Example Trades
This page contains a list of example trades using the indicators and will hopefully help train your eyes to see these types of setups on your own charts.
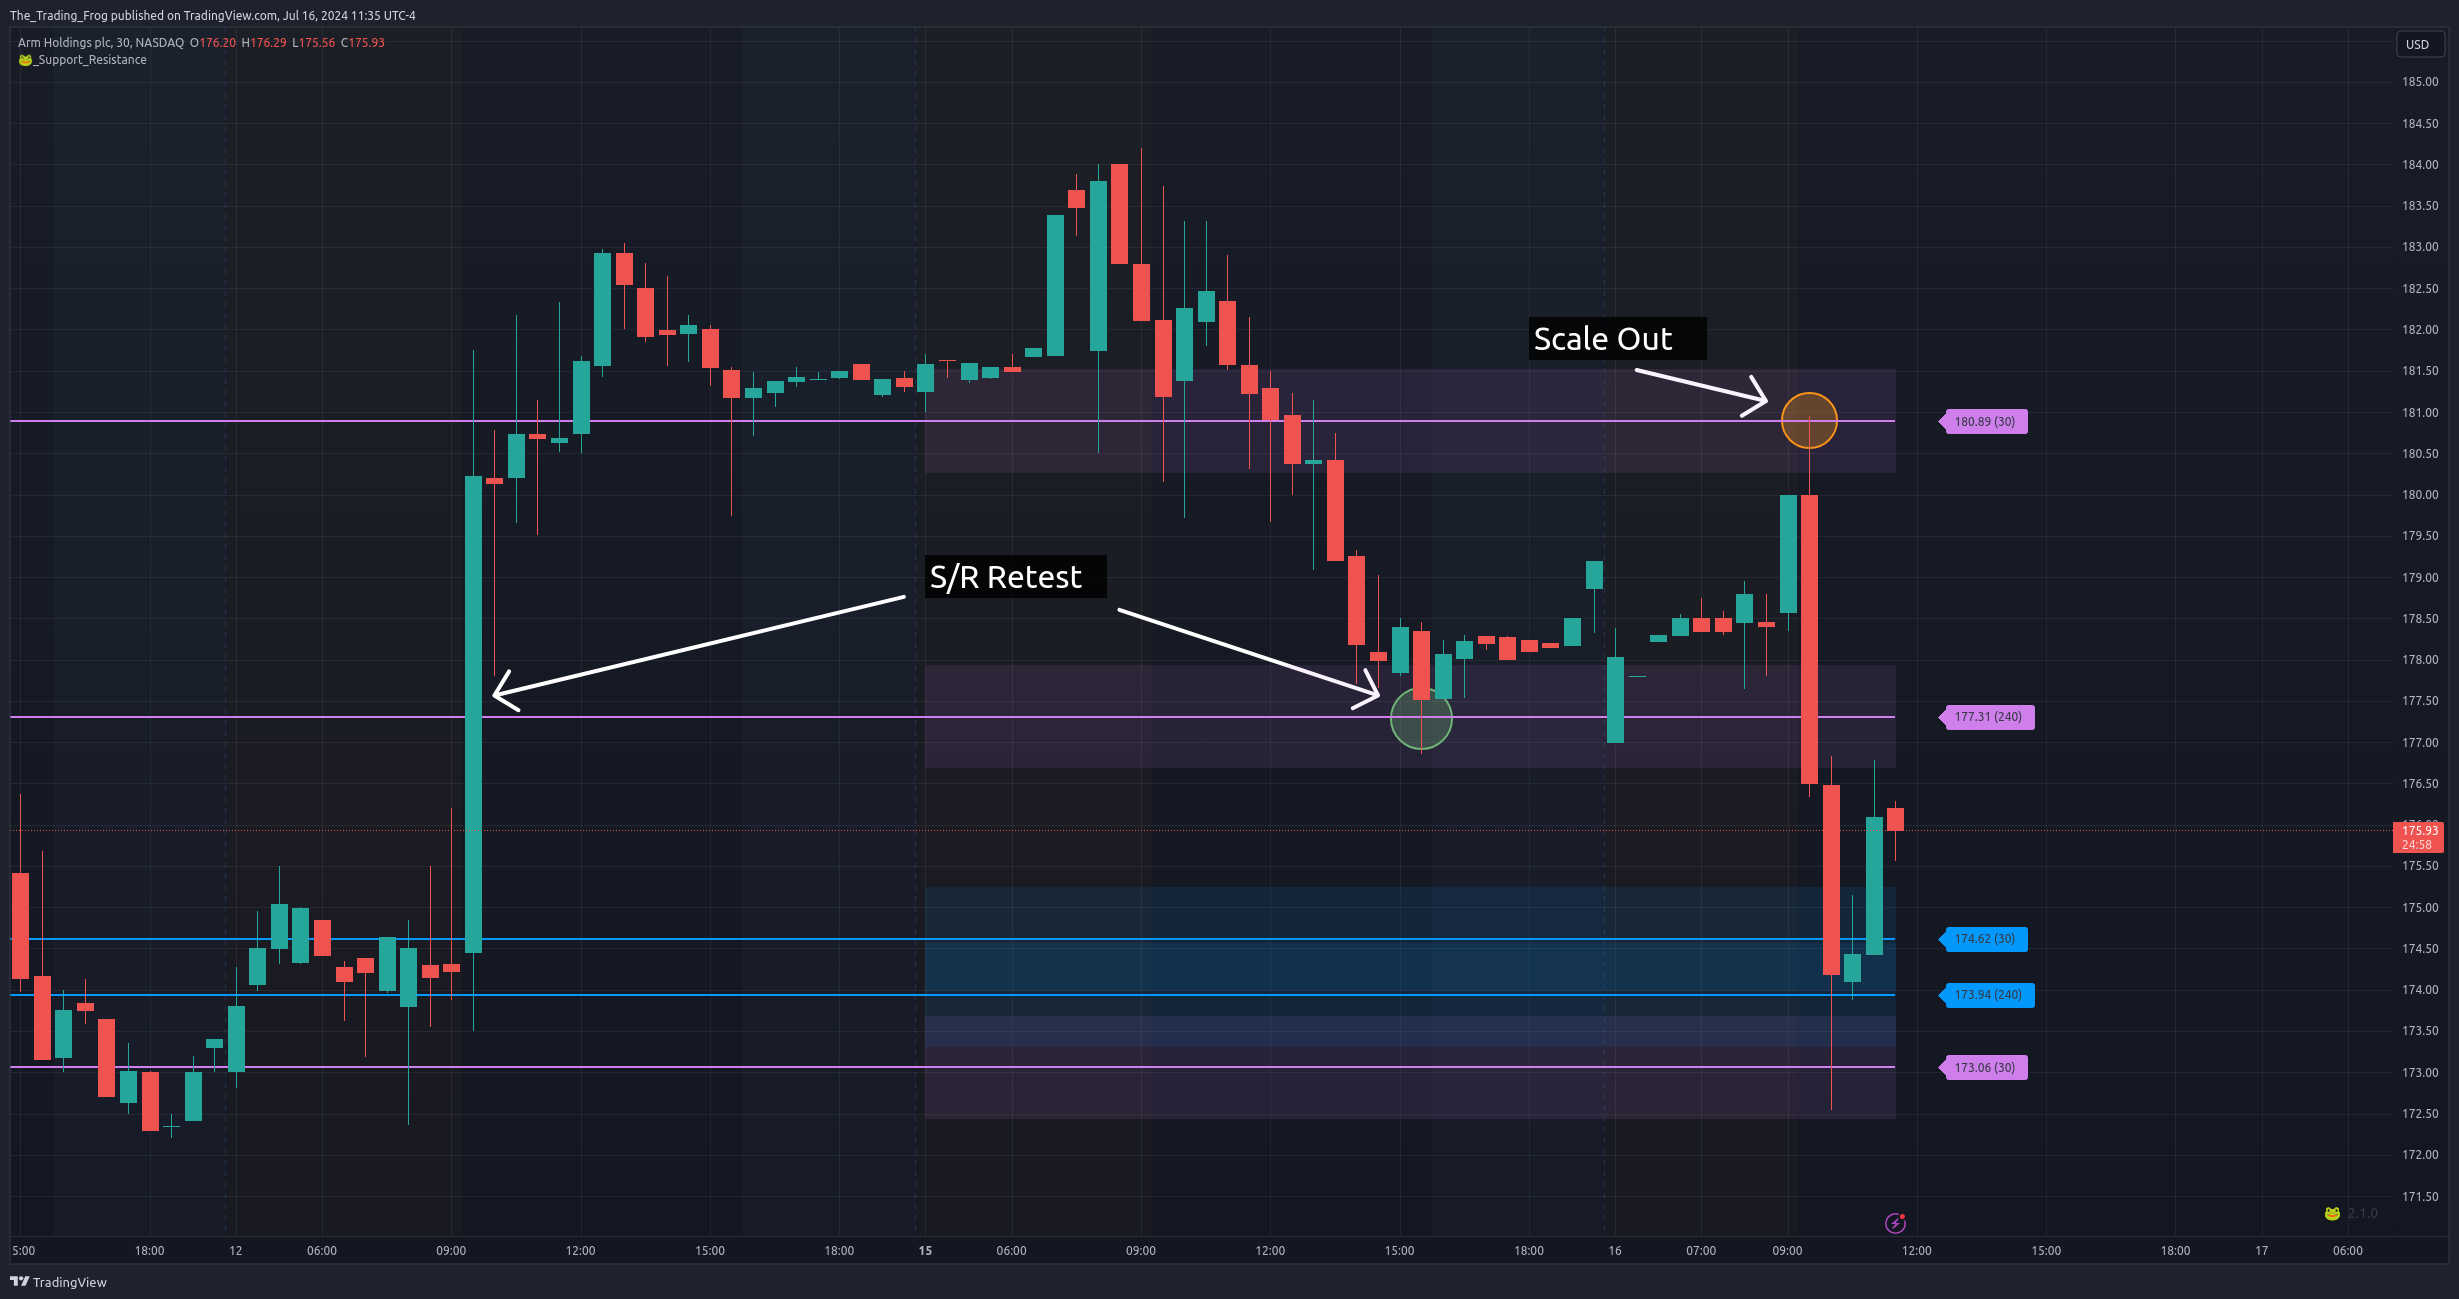
SBR Trade on ARM
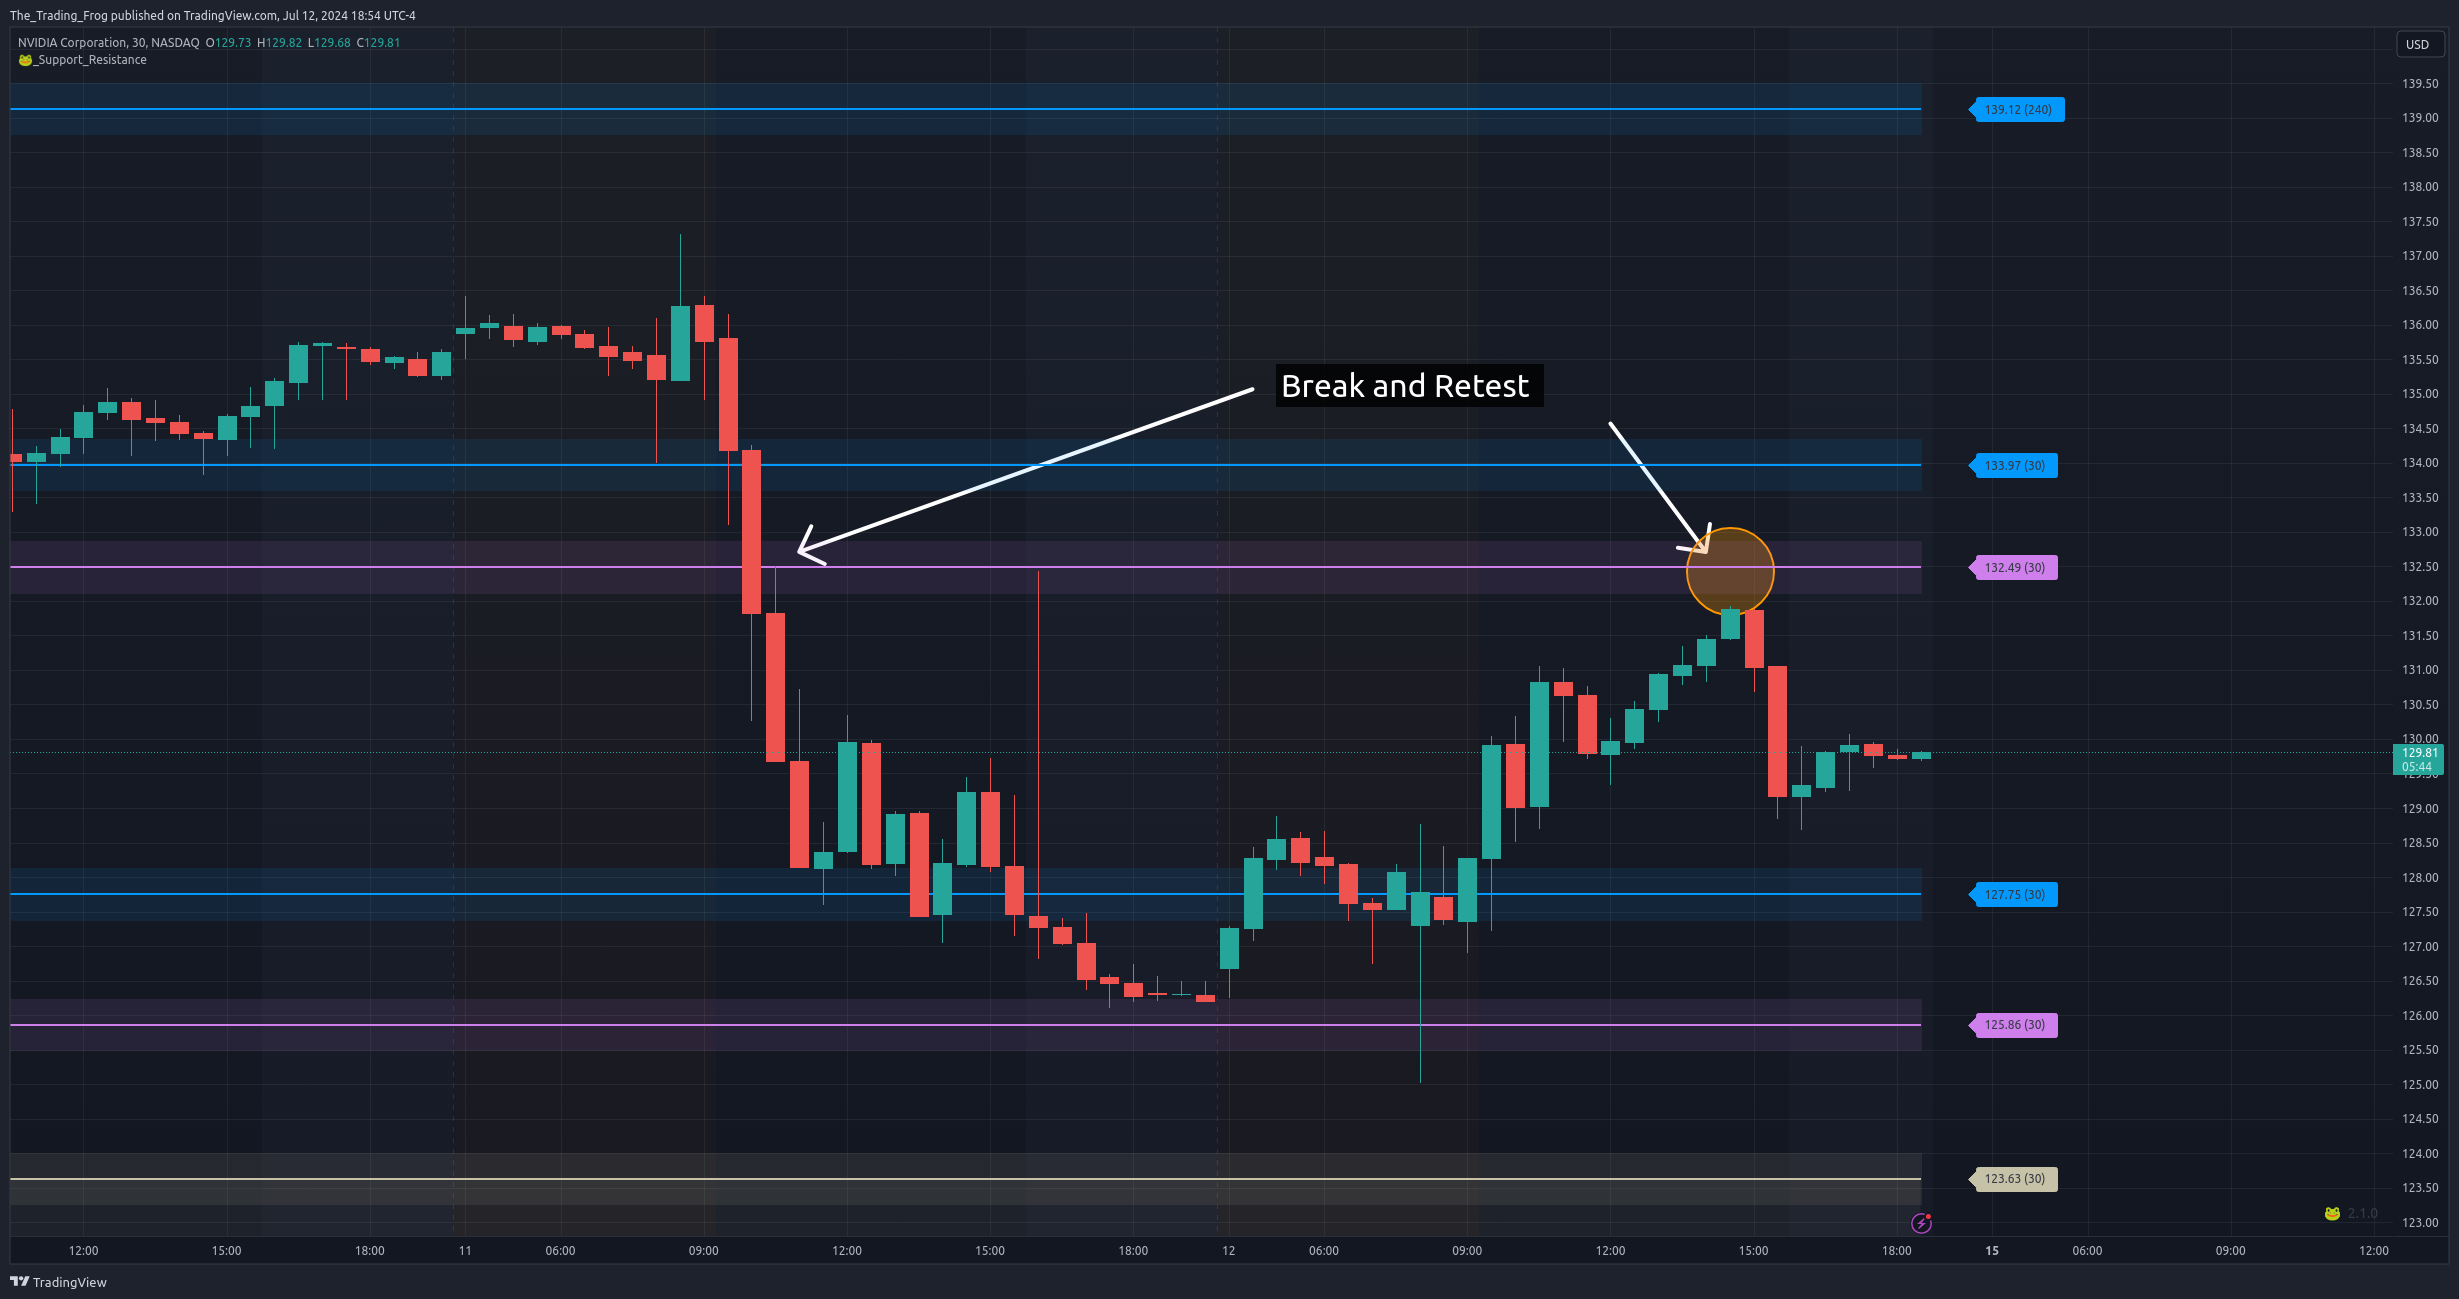
SBR Trade on NVDA
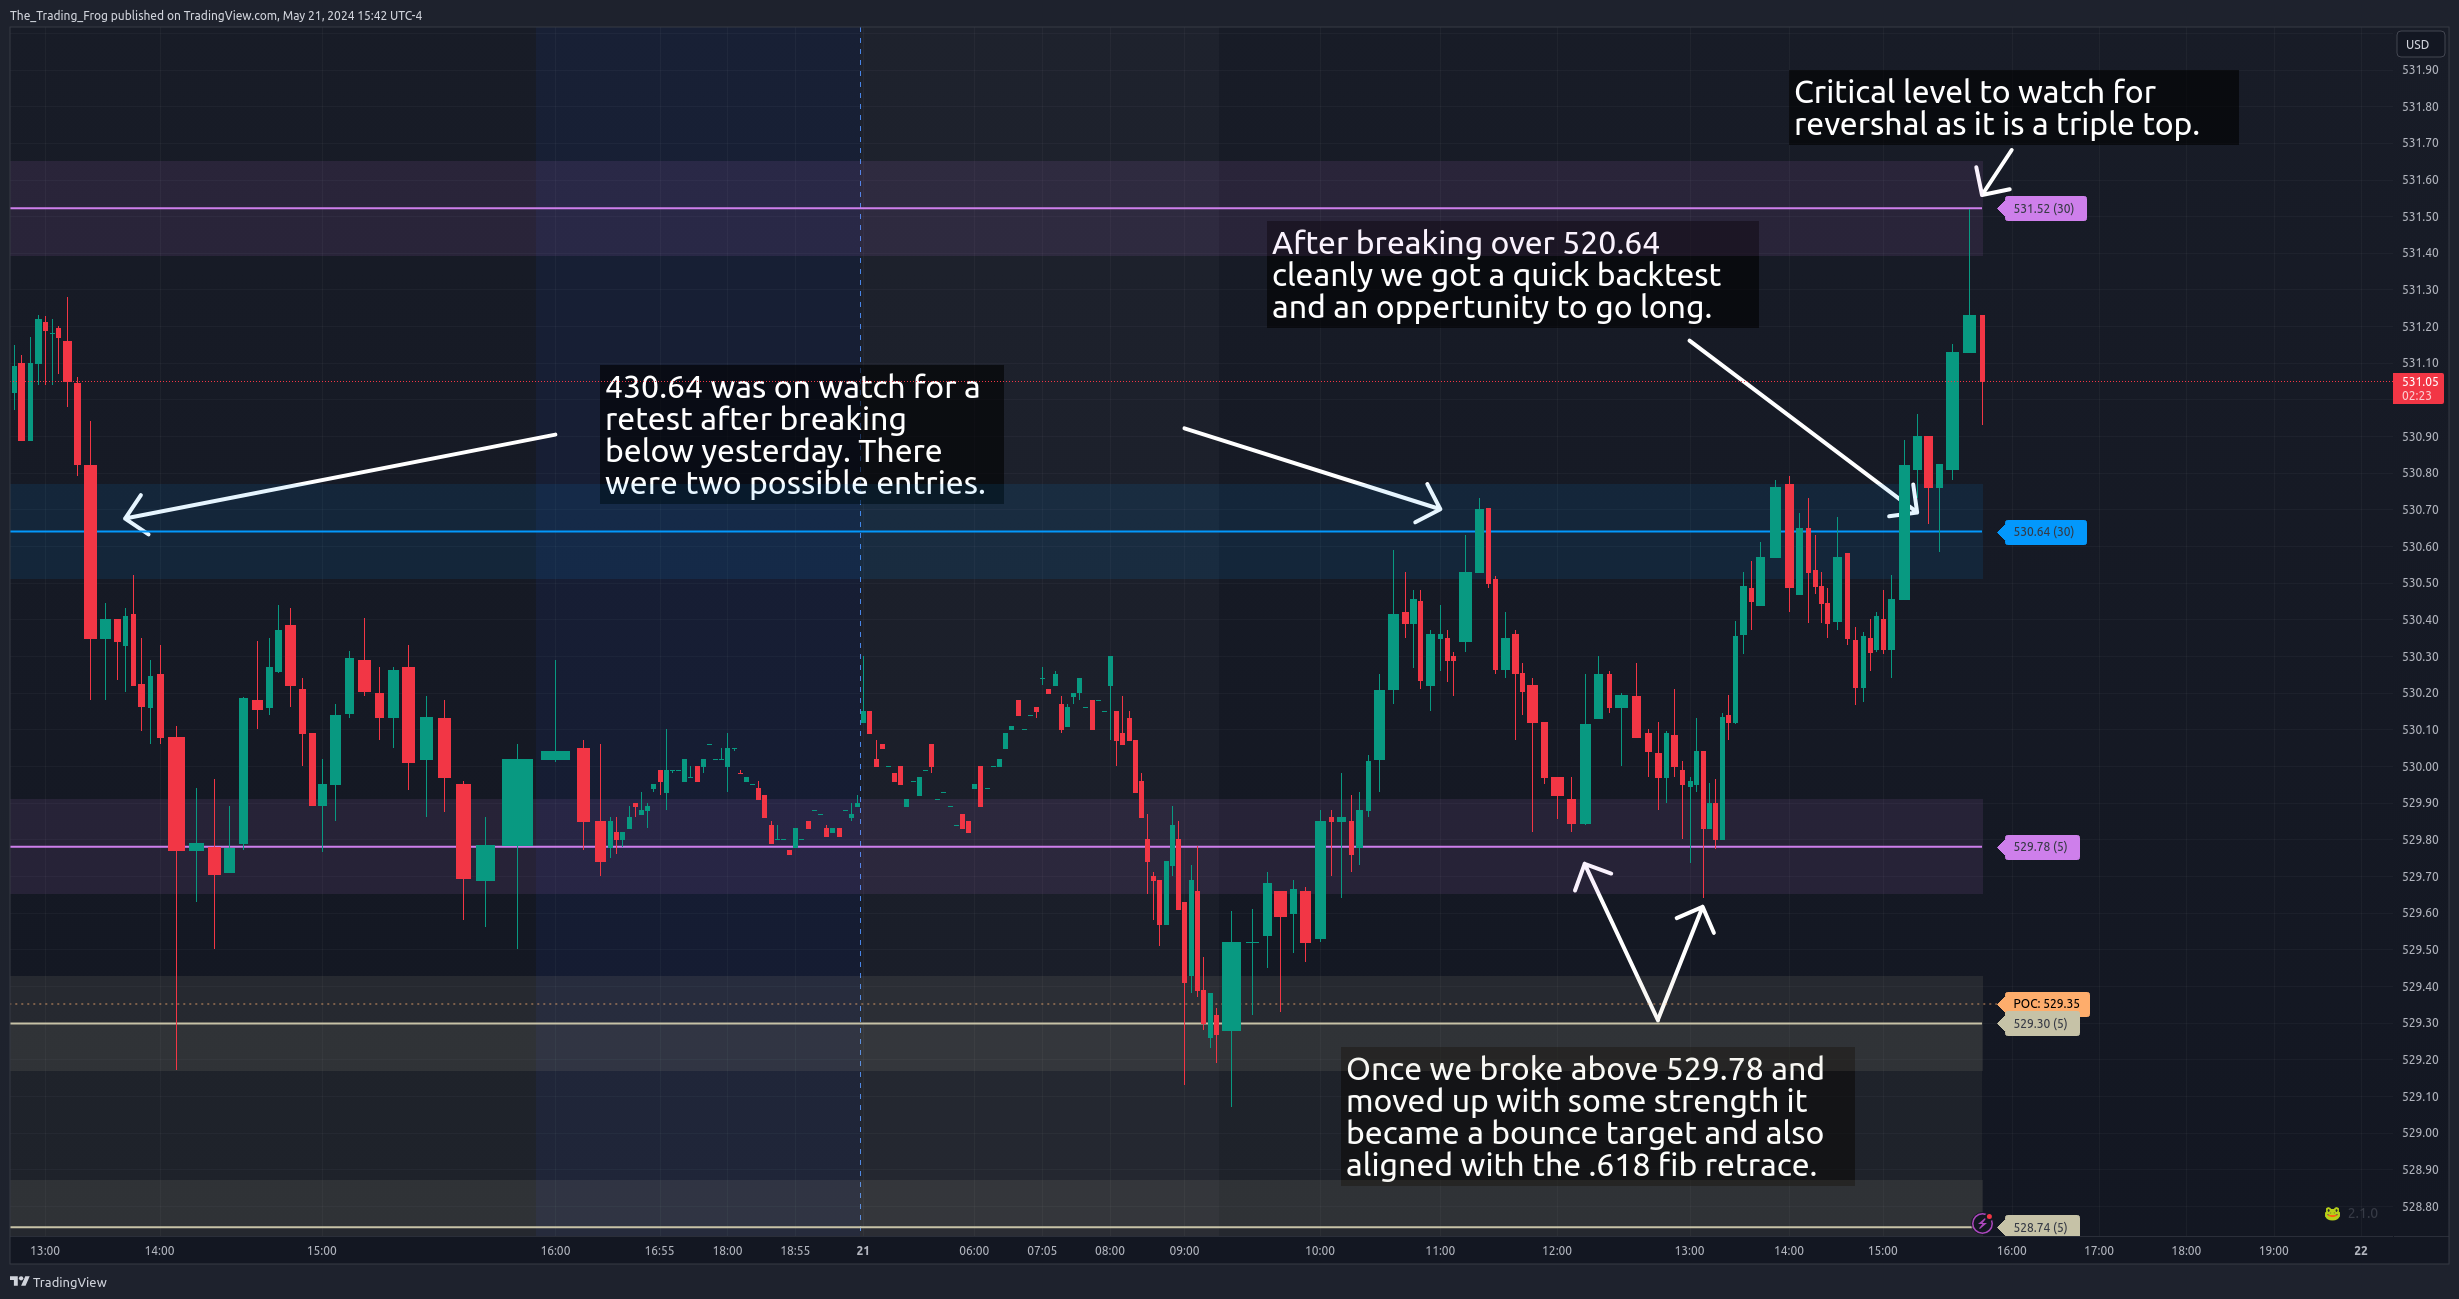
Multiple Setups on a Single Ticker
Here is an example of how you can chain several setups together for multiple profitable trades on a single ticker in short order.
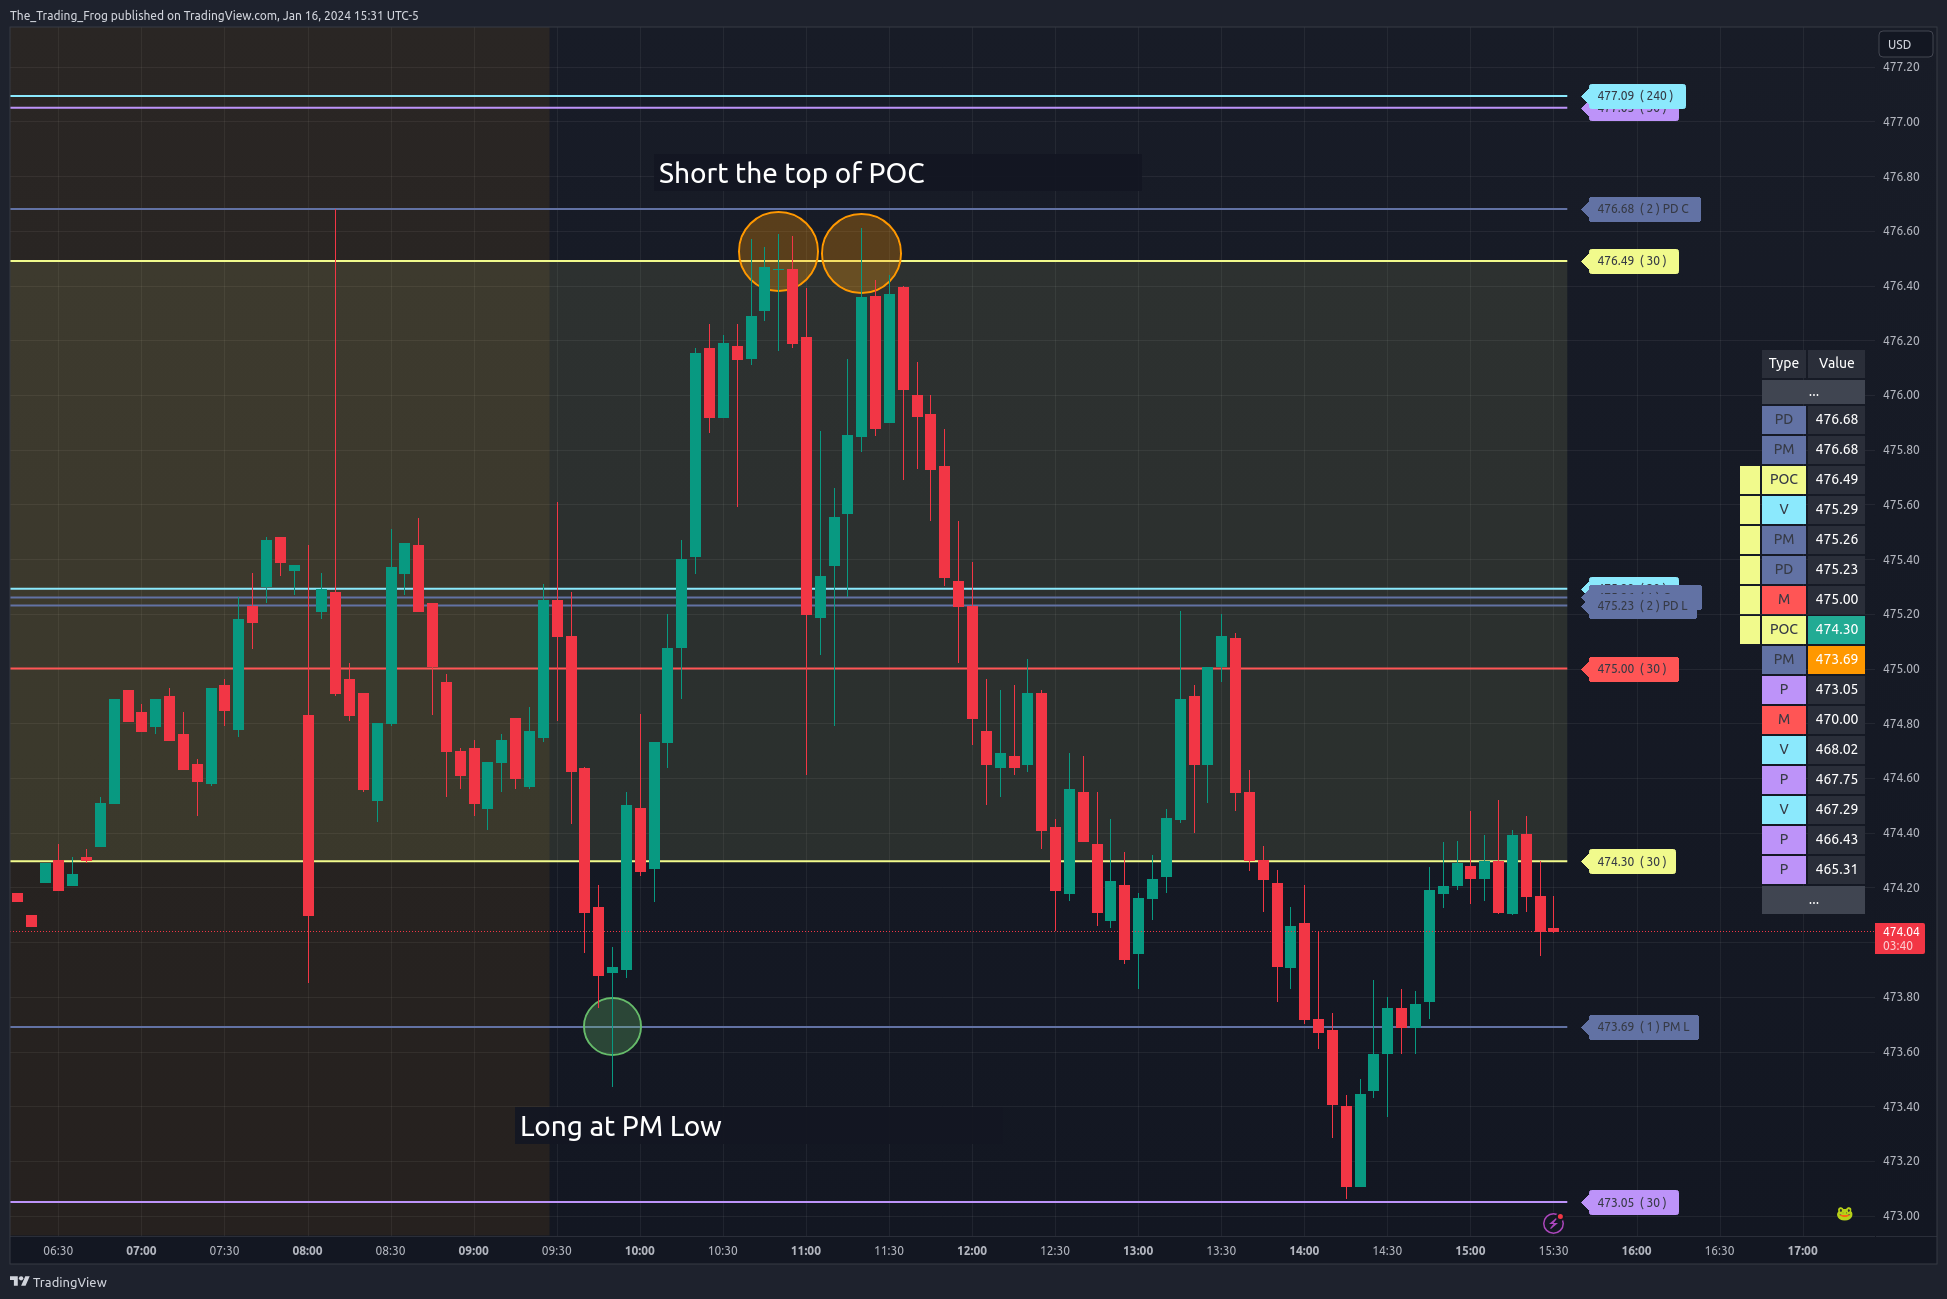
SPY - 2023/01/16: POC as Support/Resistance
The POC (Volume Point of Control) is one of the best levels to use for support / resistance. Here SPY presented an early long opportunity right after open with a retest of the Pre-Market low. You can see how each test of the top of the POC was rejected hard, providing good short opportunities.
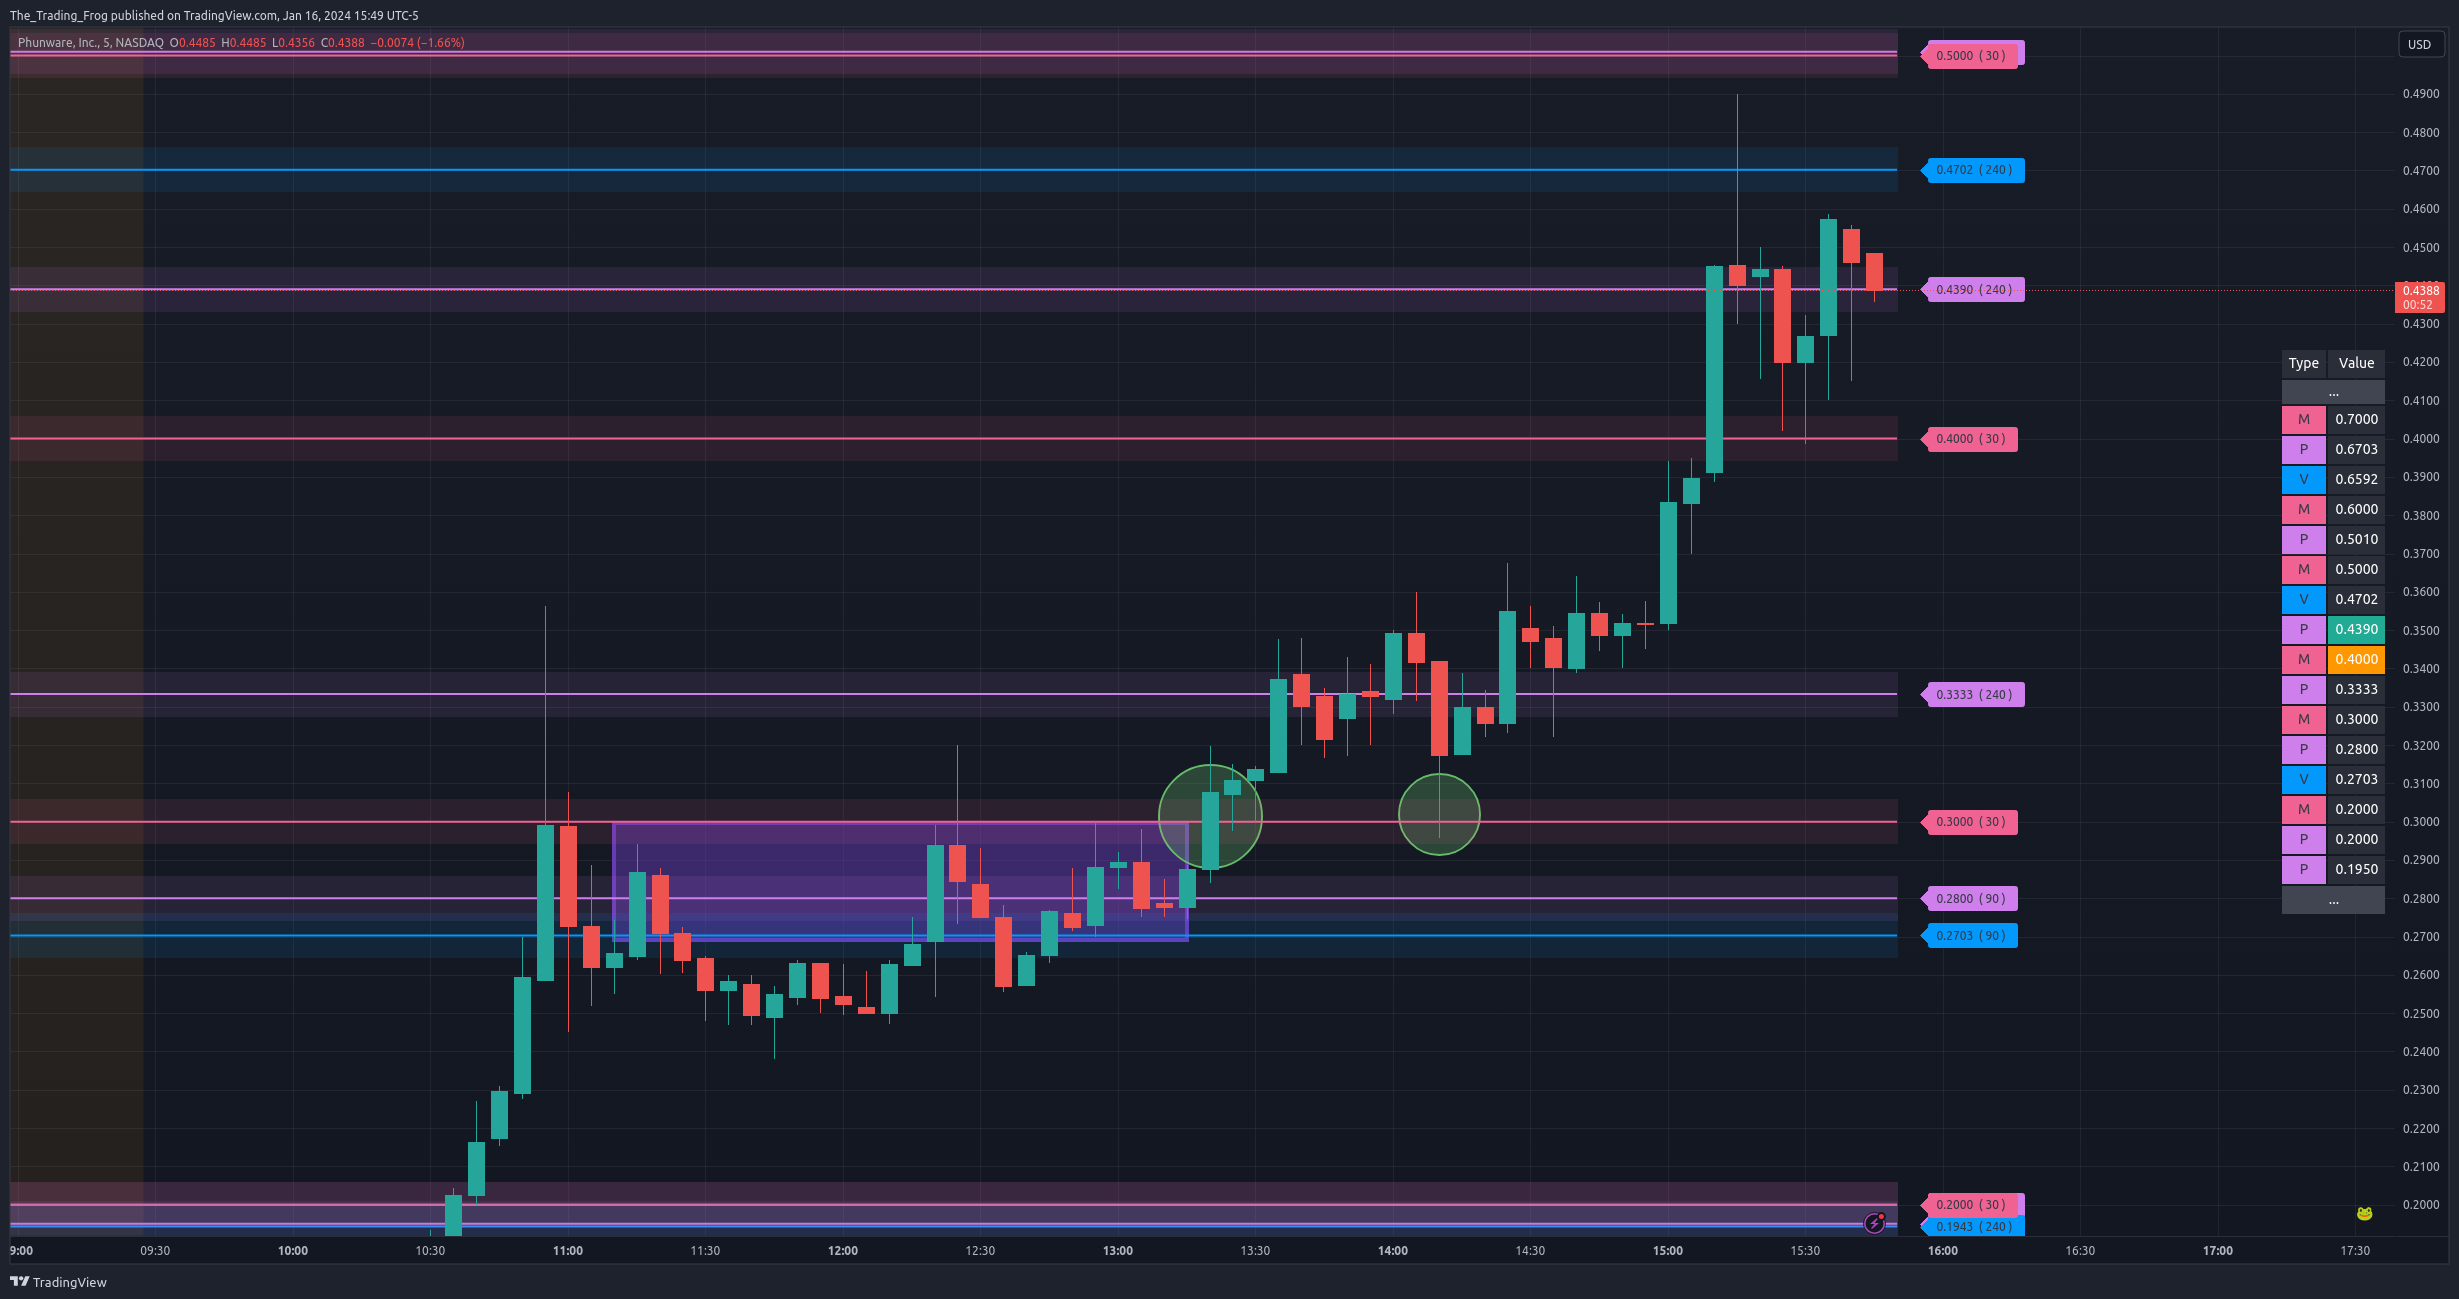
PHUN - 2023/01/16: Break of Mental Level
PHUN provided several great trades on this day. The best was watching for the break of the “Mental” level $3.00 after price had consolidated under it. The purple box shows price consolidating under the $3.00 level. After breaking above you could go long. Ideally, it is great to see a level retested before the next leg up. Here you can see the retest in the second green circle.
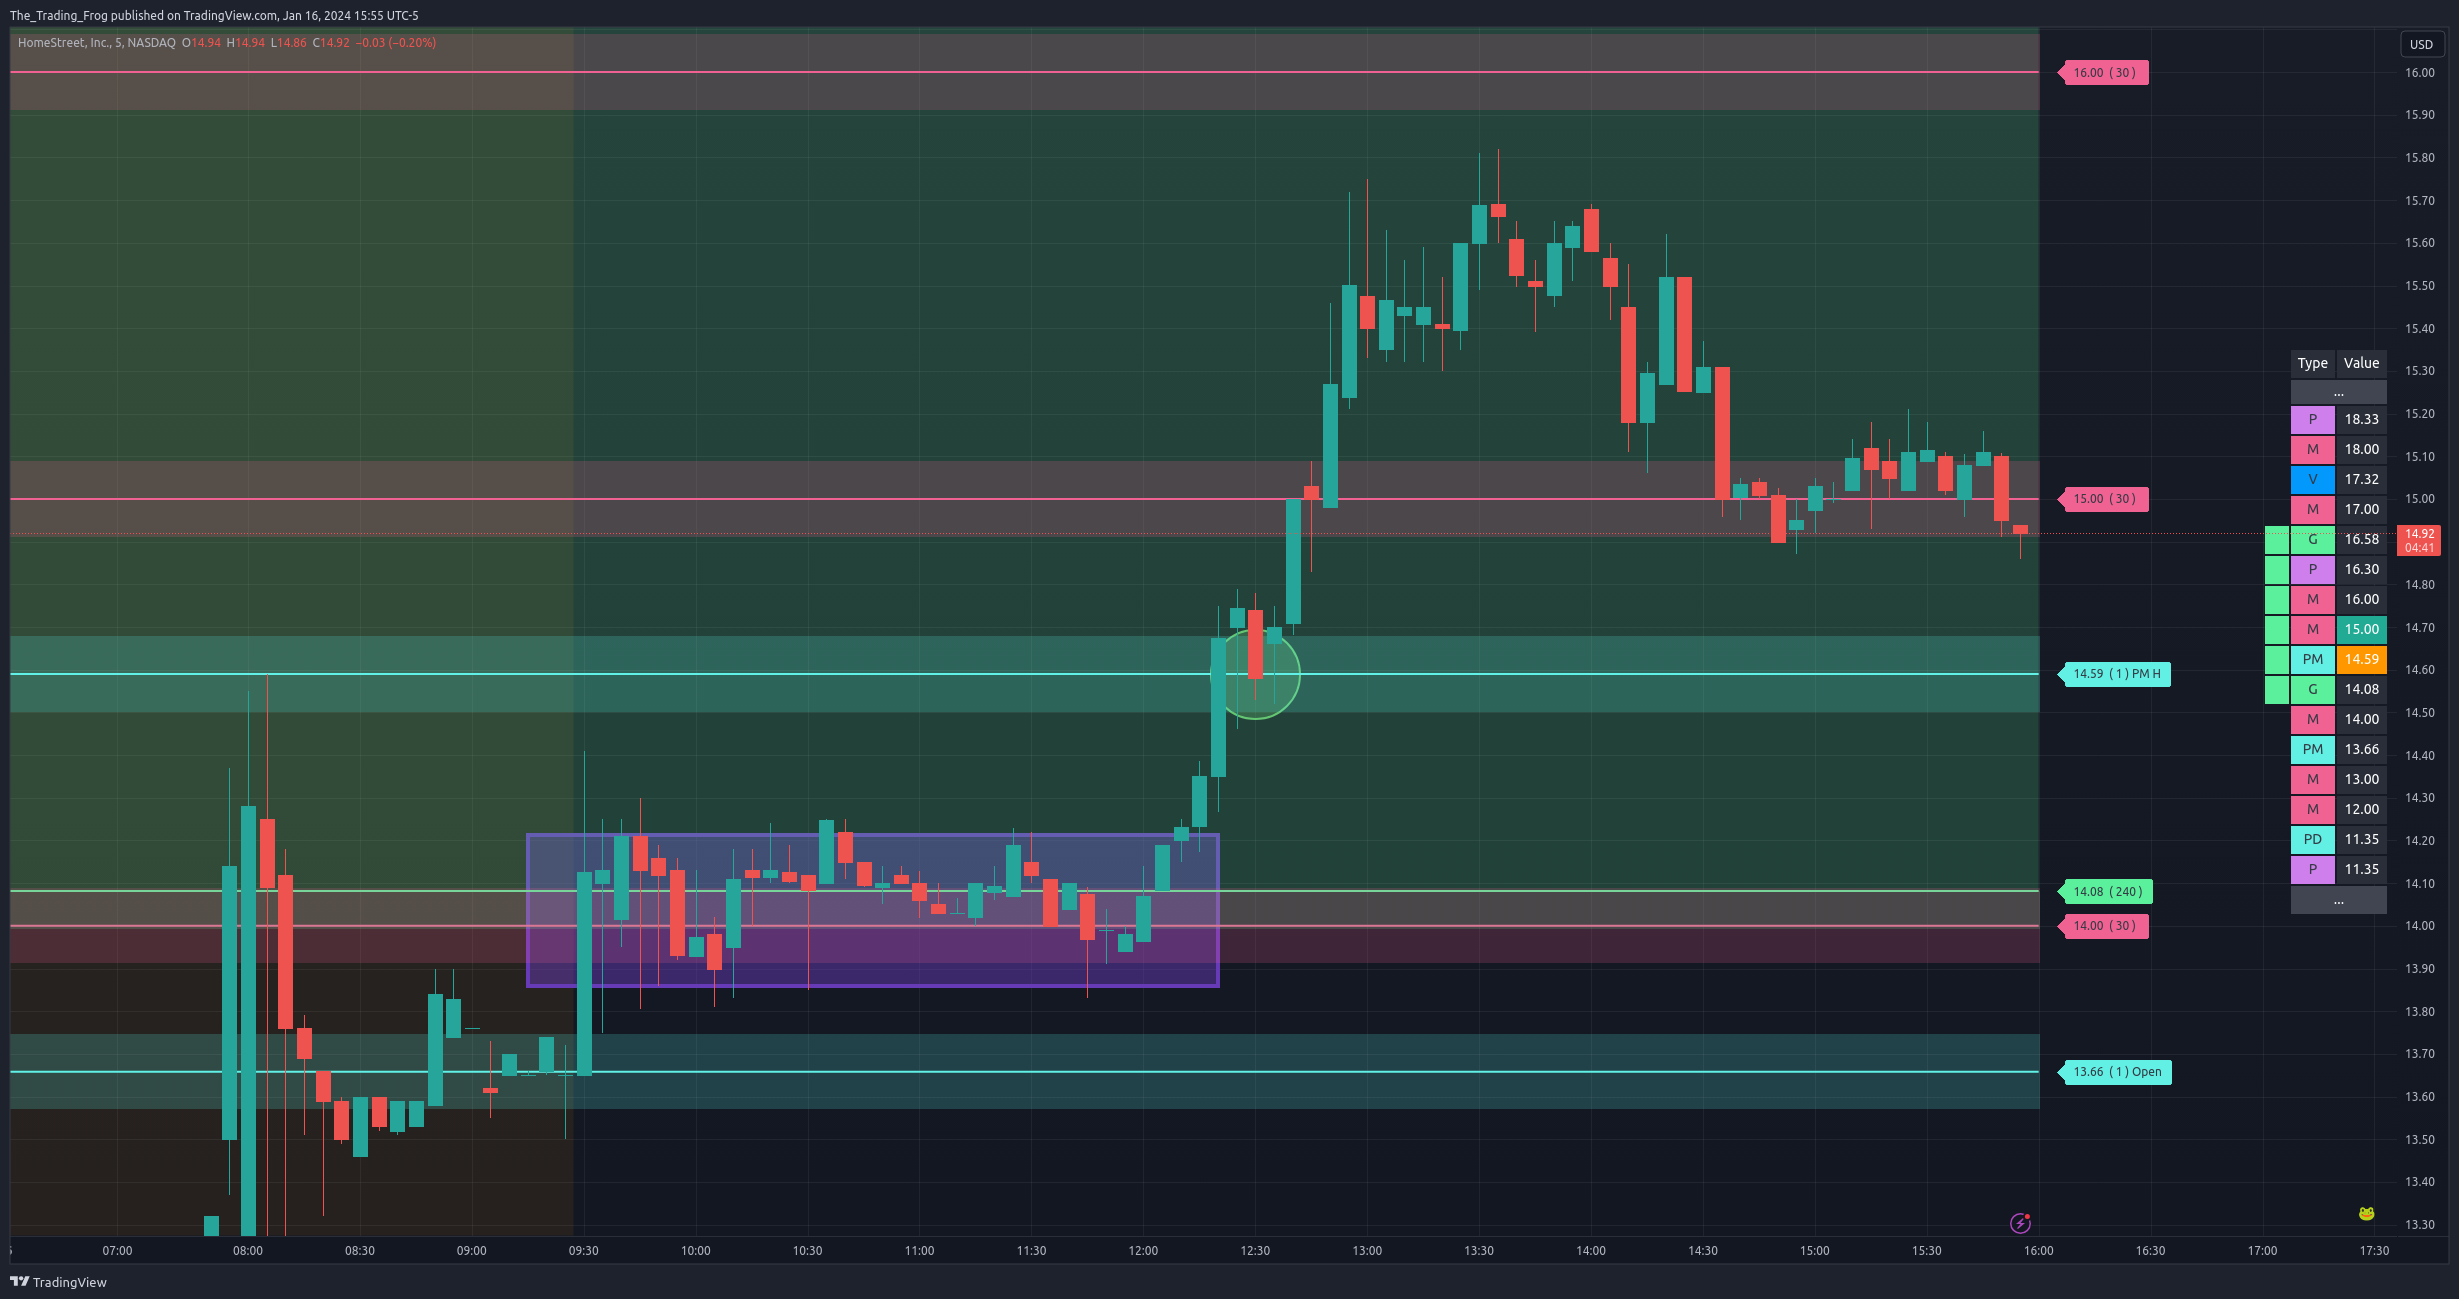
HMST - 2023/01/16: Consolidation at PM High
HMST created a PM high and then consolidated at the bottom of the GAP. It then moved up again into the gap and consolidated at the PM high. This would be a good spot to watch for a next leg with tight stops under the PM high.
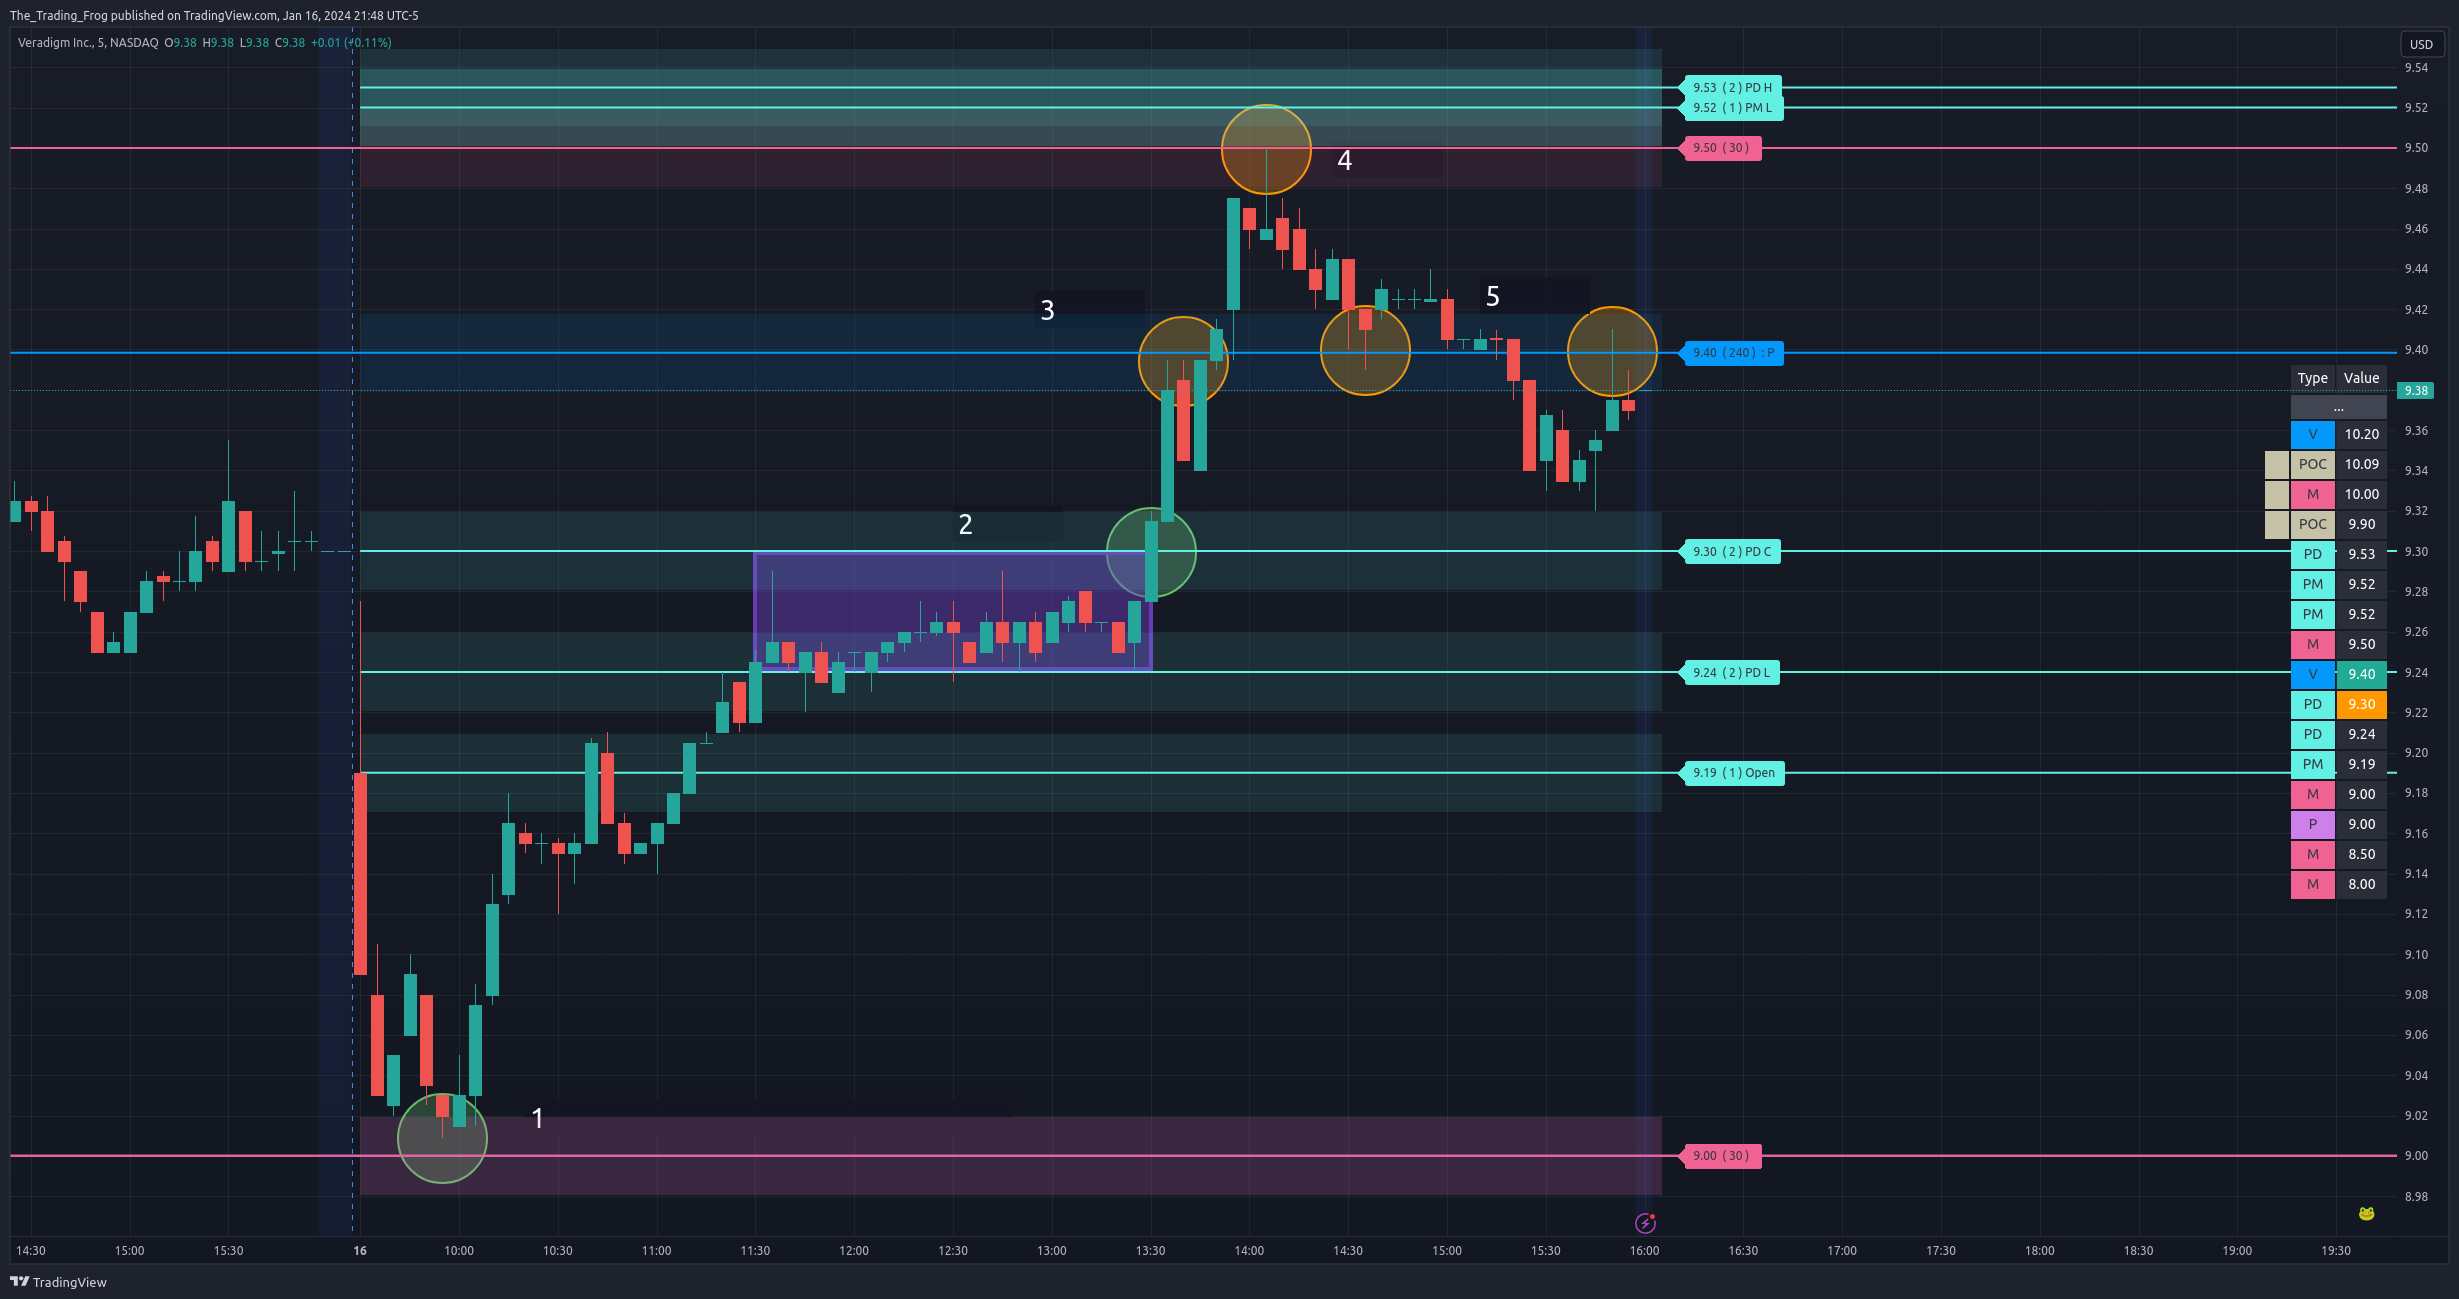
MDRX - 2023/01/16: Clean Follow-Through
Look how cleanly MDRX followed the levels on this trade.
- At open it fell and found support at $9.00 a mental level (1).
- It then bounced and began to consolidate between the PDL and PDC (2).
- Breaking out of this range it continued up until it found resistance at 9.40 a volume and price resistance levels (3).
- Clearing this level it finally found it’s peak at 9.50 (4) another mental level.
- Afterward you can see how the 9.40 level was tested once as support and then resistance (5).
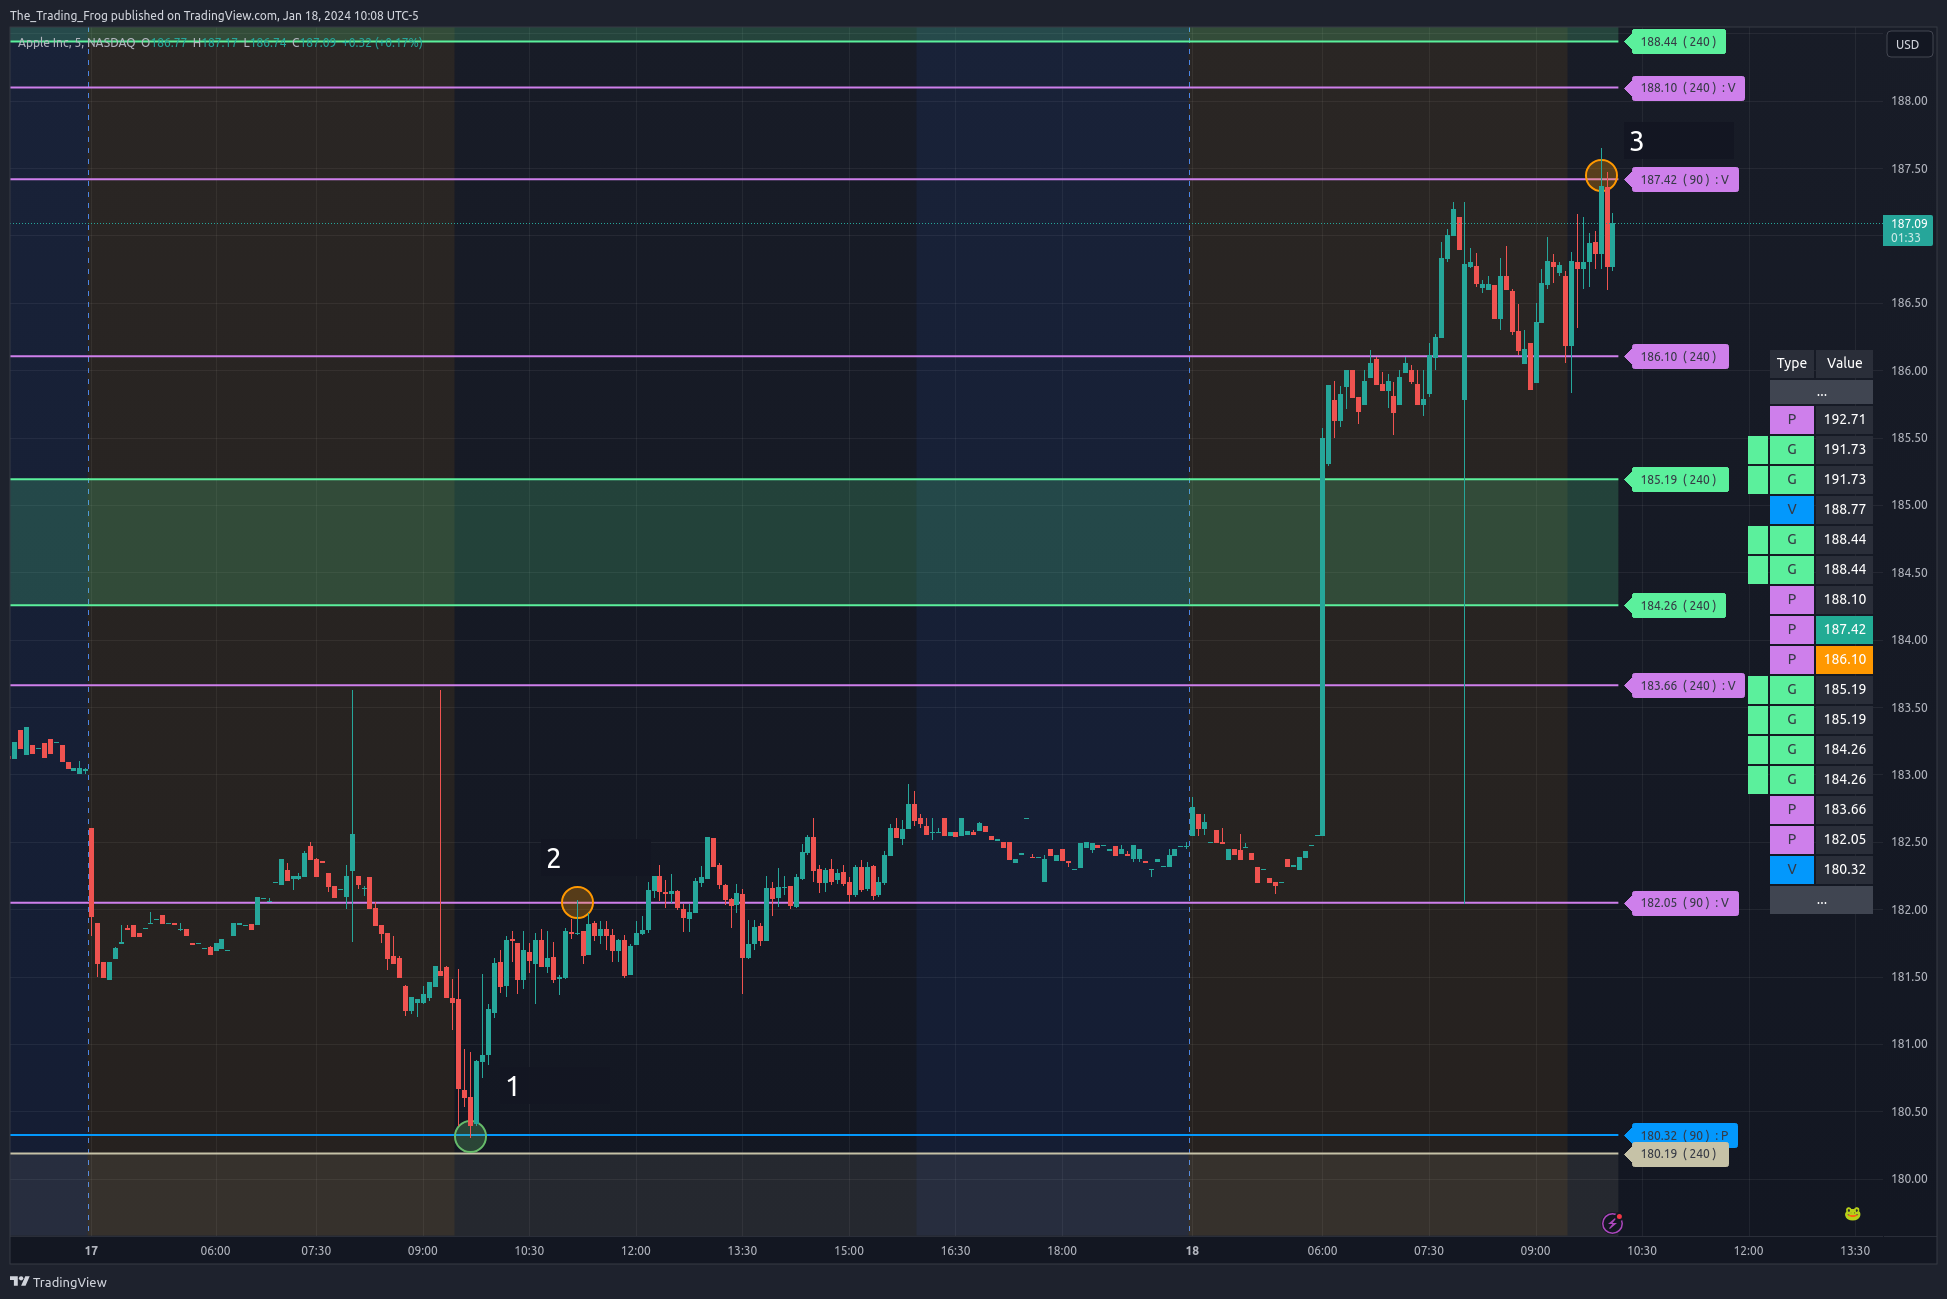
AAPL - 2023/01/17: Volume and Price Level
Apple dipped early in the day bouncing right at a volume and price level 180.32. Added calls at (1) and held until price got to the next level higher at 182.05 to scale out half (2). The last half was sold for 700% gains at circle (3).
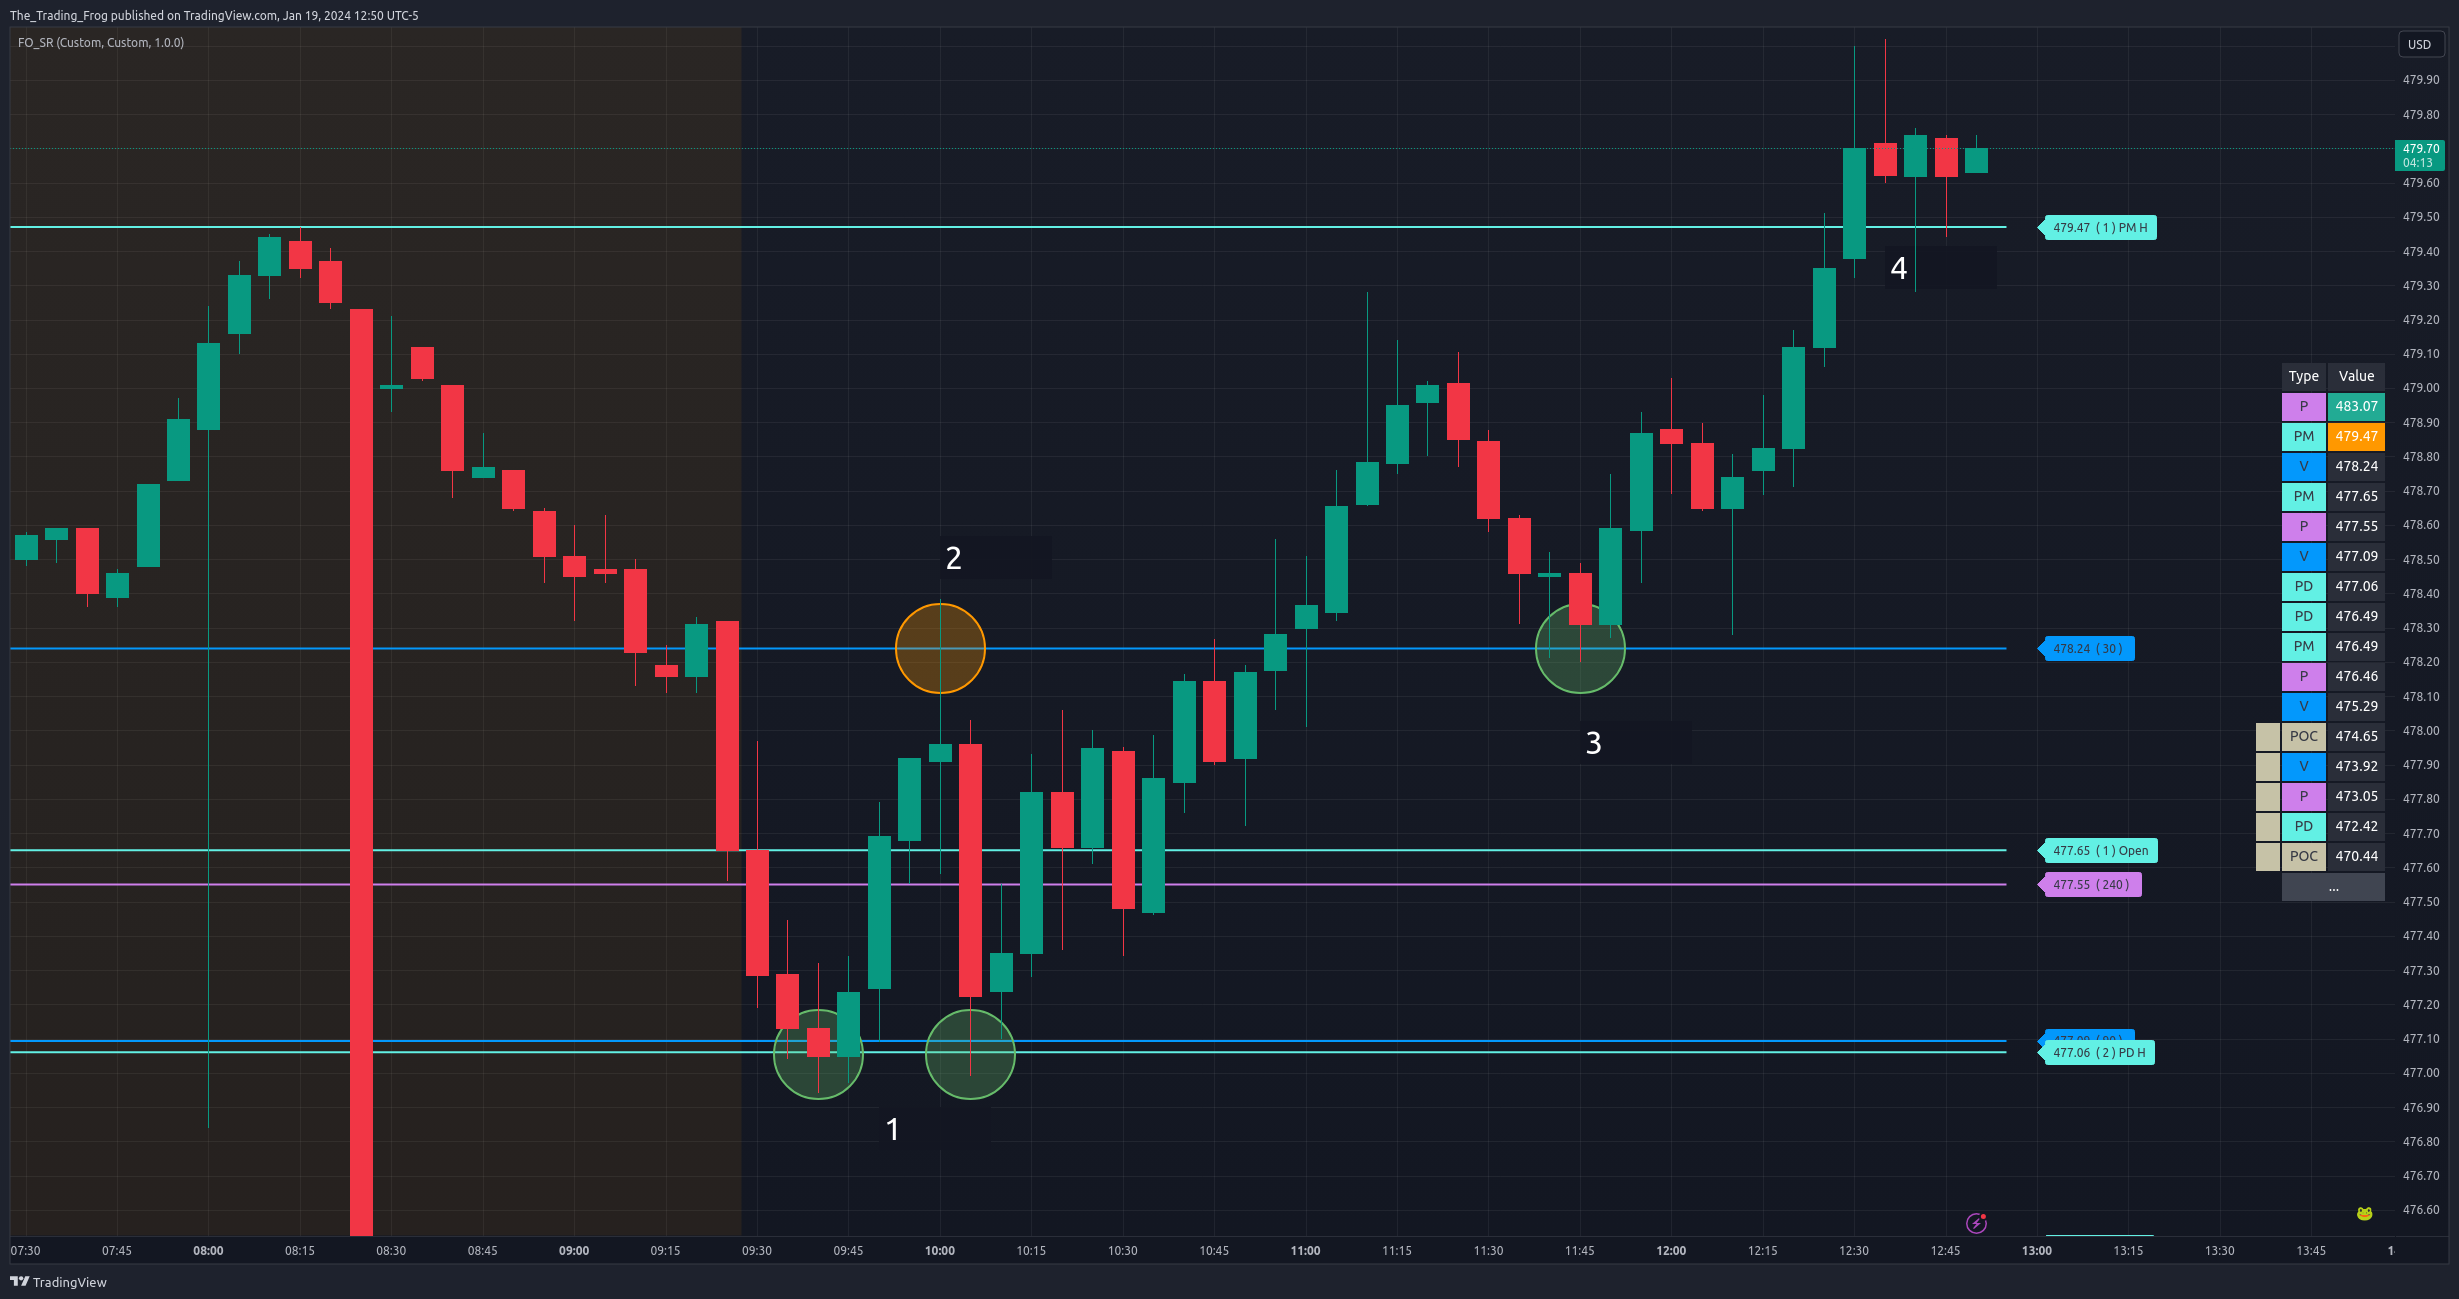
SPY - 2023/01/19: Range-Bound Levels
This setup shows one of the best ways to leverage these levels. Look at how SPY is range bound between (1) and (2). You could scalp these levels while waiting for a break in one direction or another. In this case SPY broke up, and while you could trade the break of resistance, another option is to wait for the retest. At (3) we see a perfect back-test and then SPY continued up to the PMH (4) .
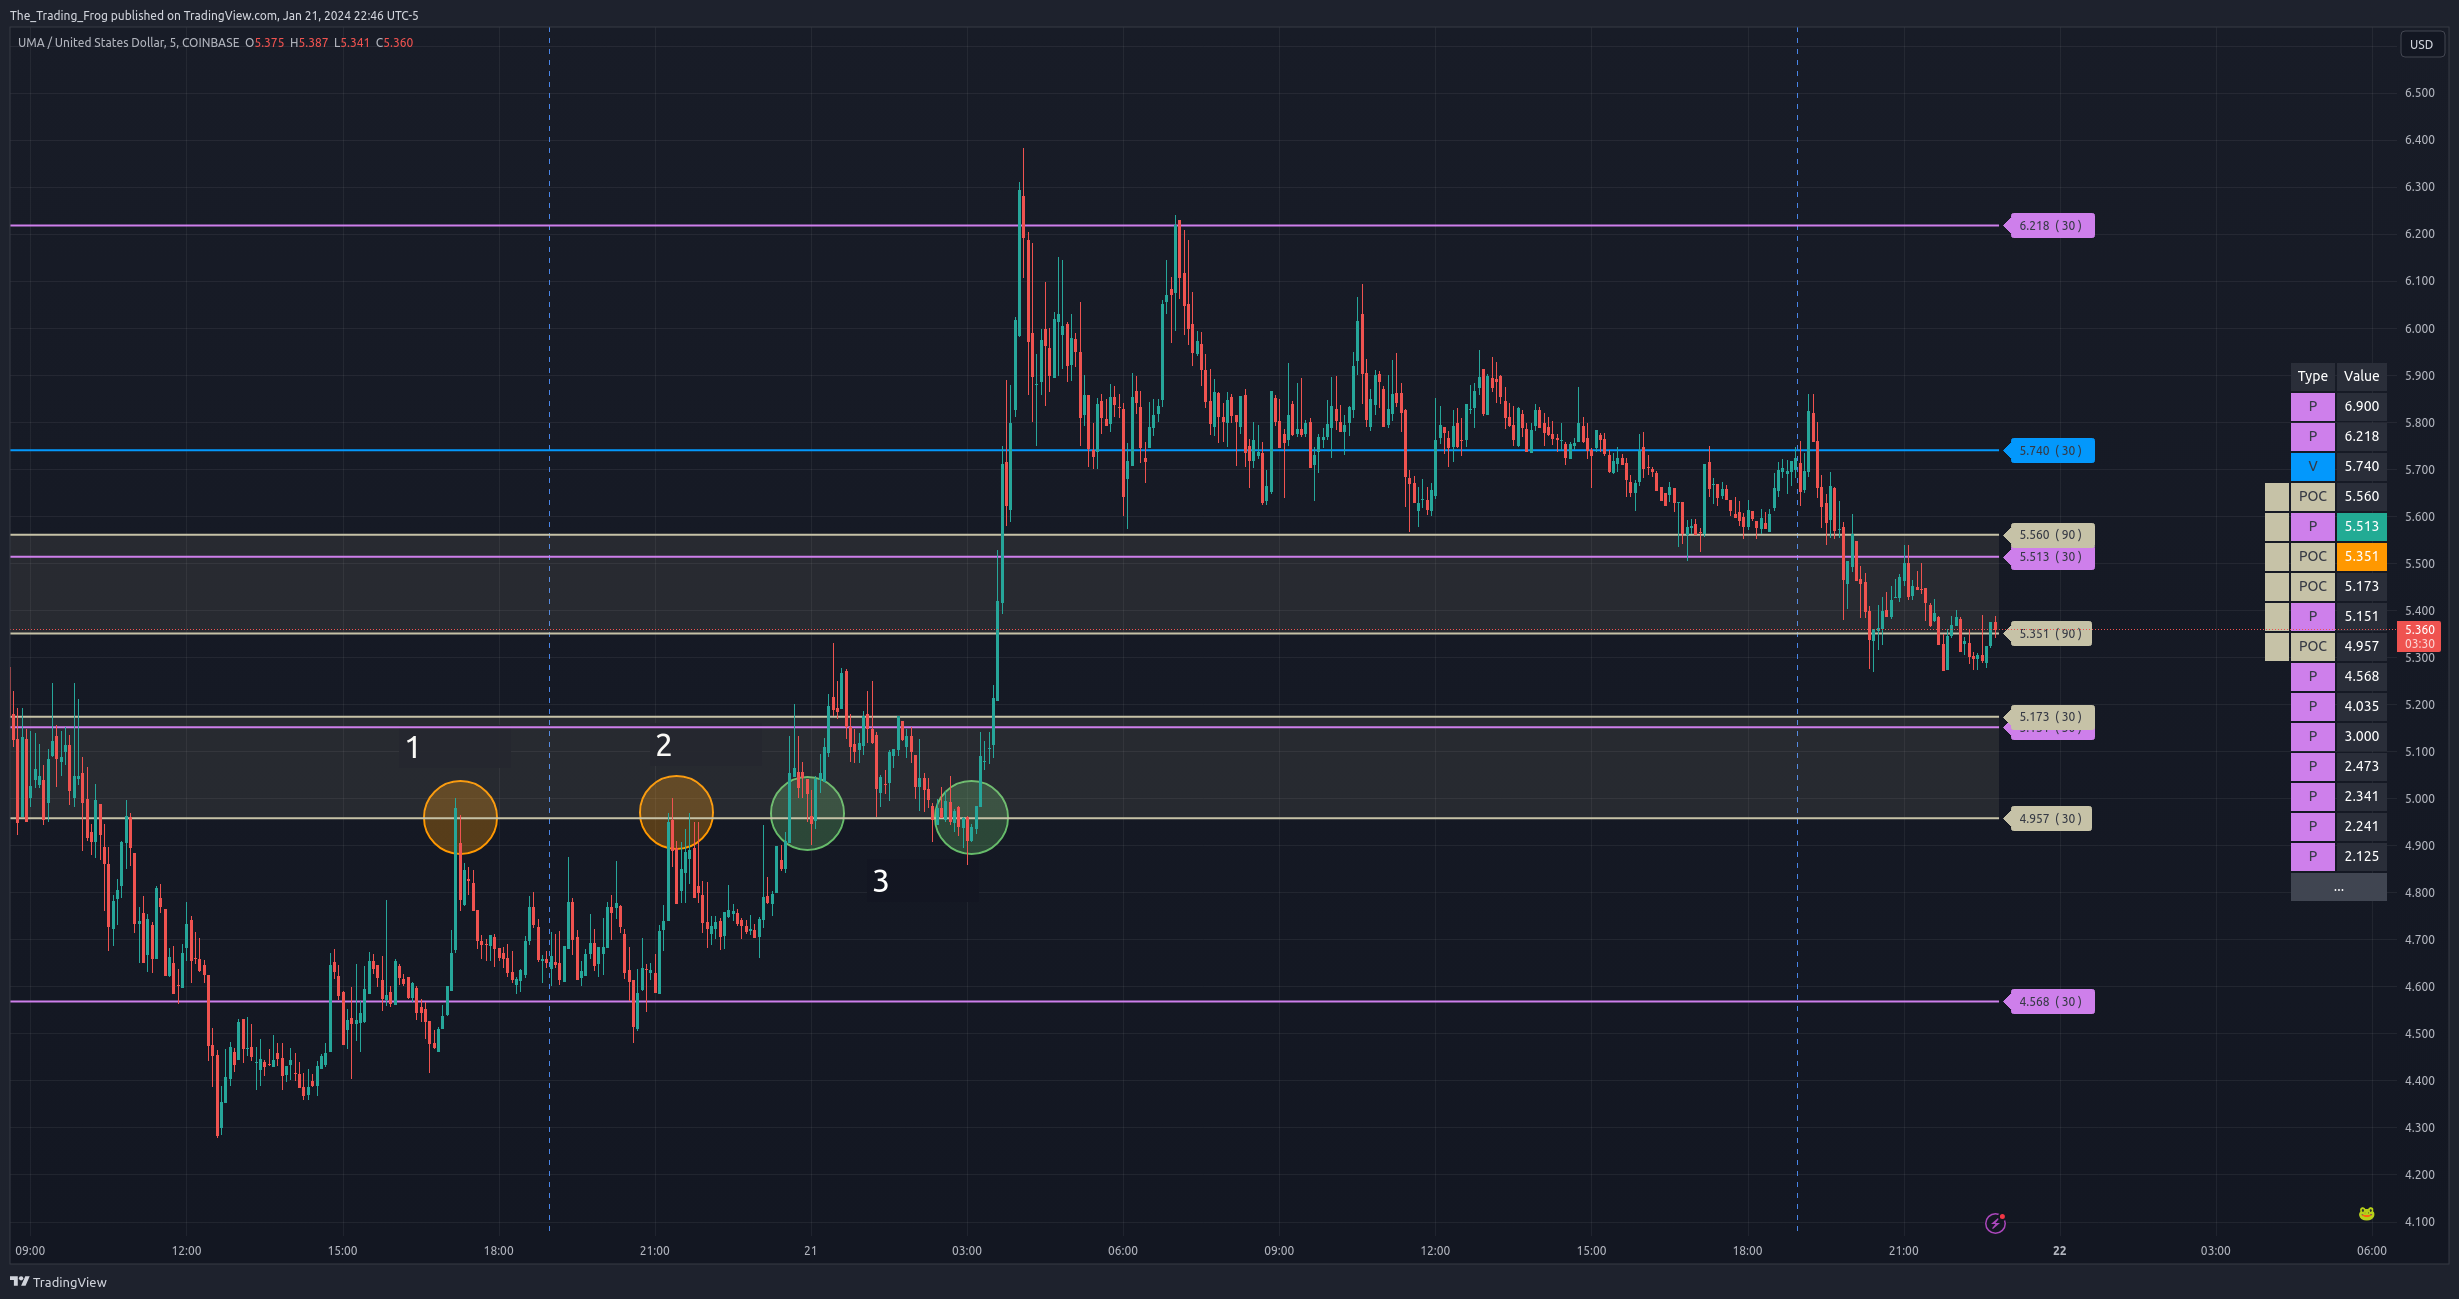
UMA.X - 2023/01/21: Break and Retest
Here on UMA.X is another example of a break and then retest preceding a large move up.
- At (1) and (2) the bottom of the POC is tested and rejected.
- The price then breaks above and retests twice (3).
- The second retest propels it up explosively but either retest would have resulted in a profitable trade.
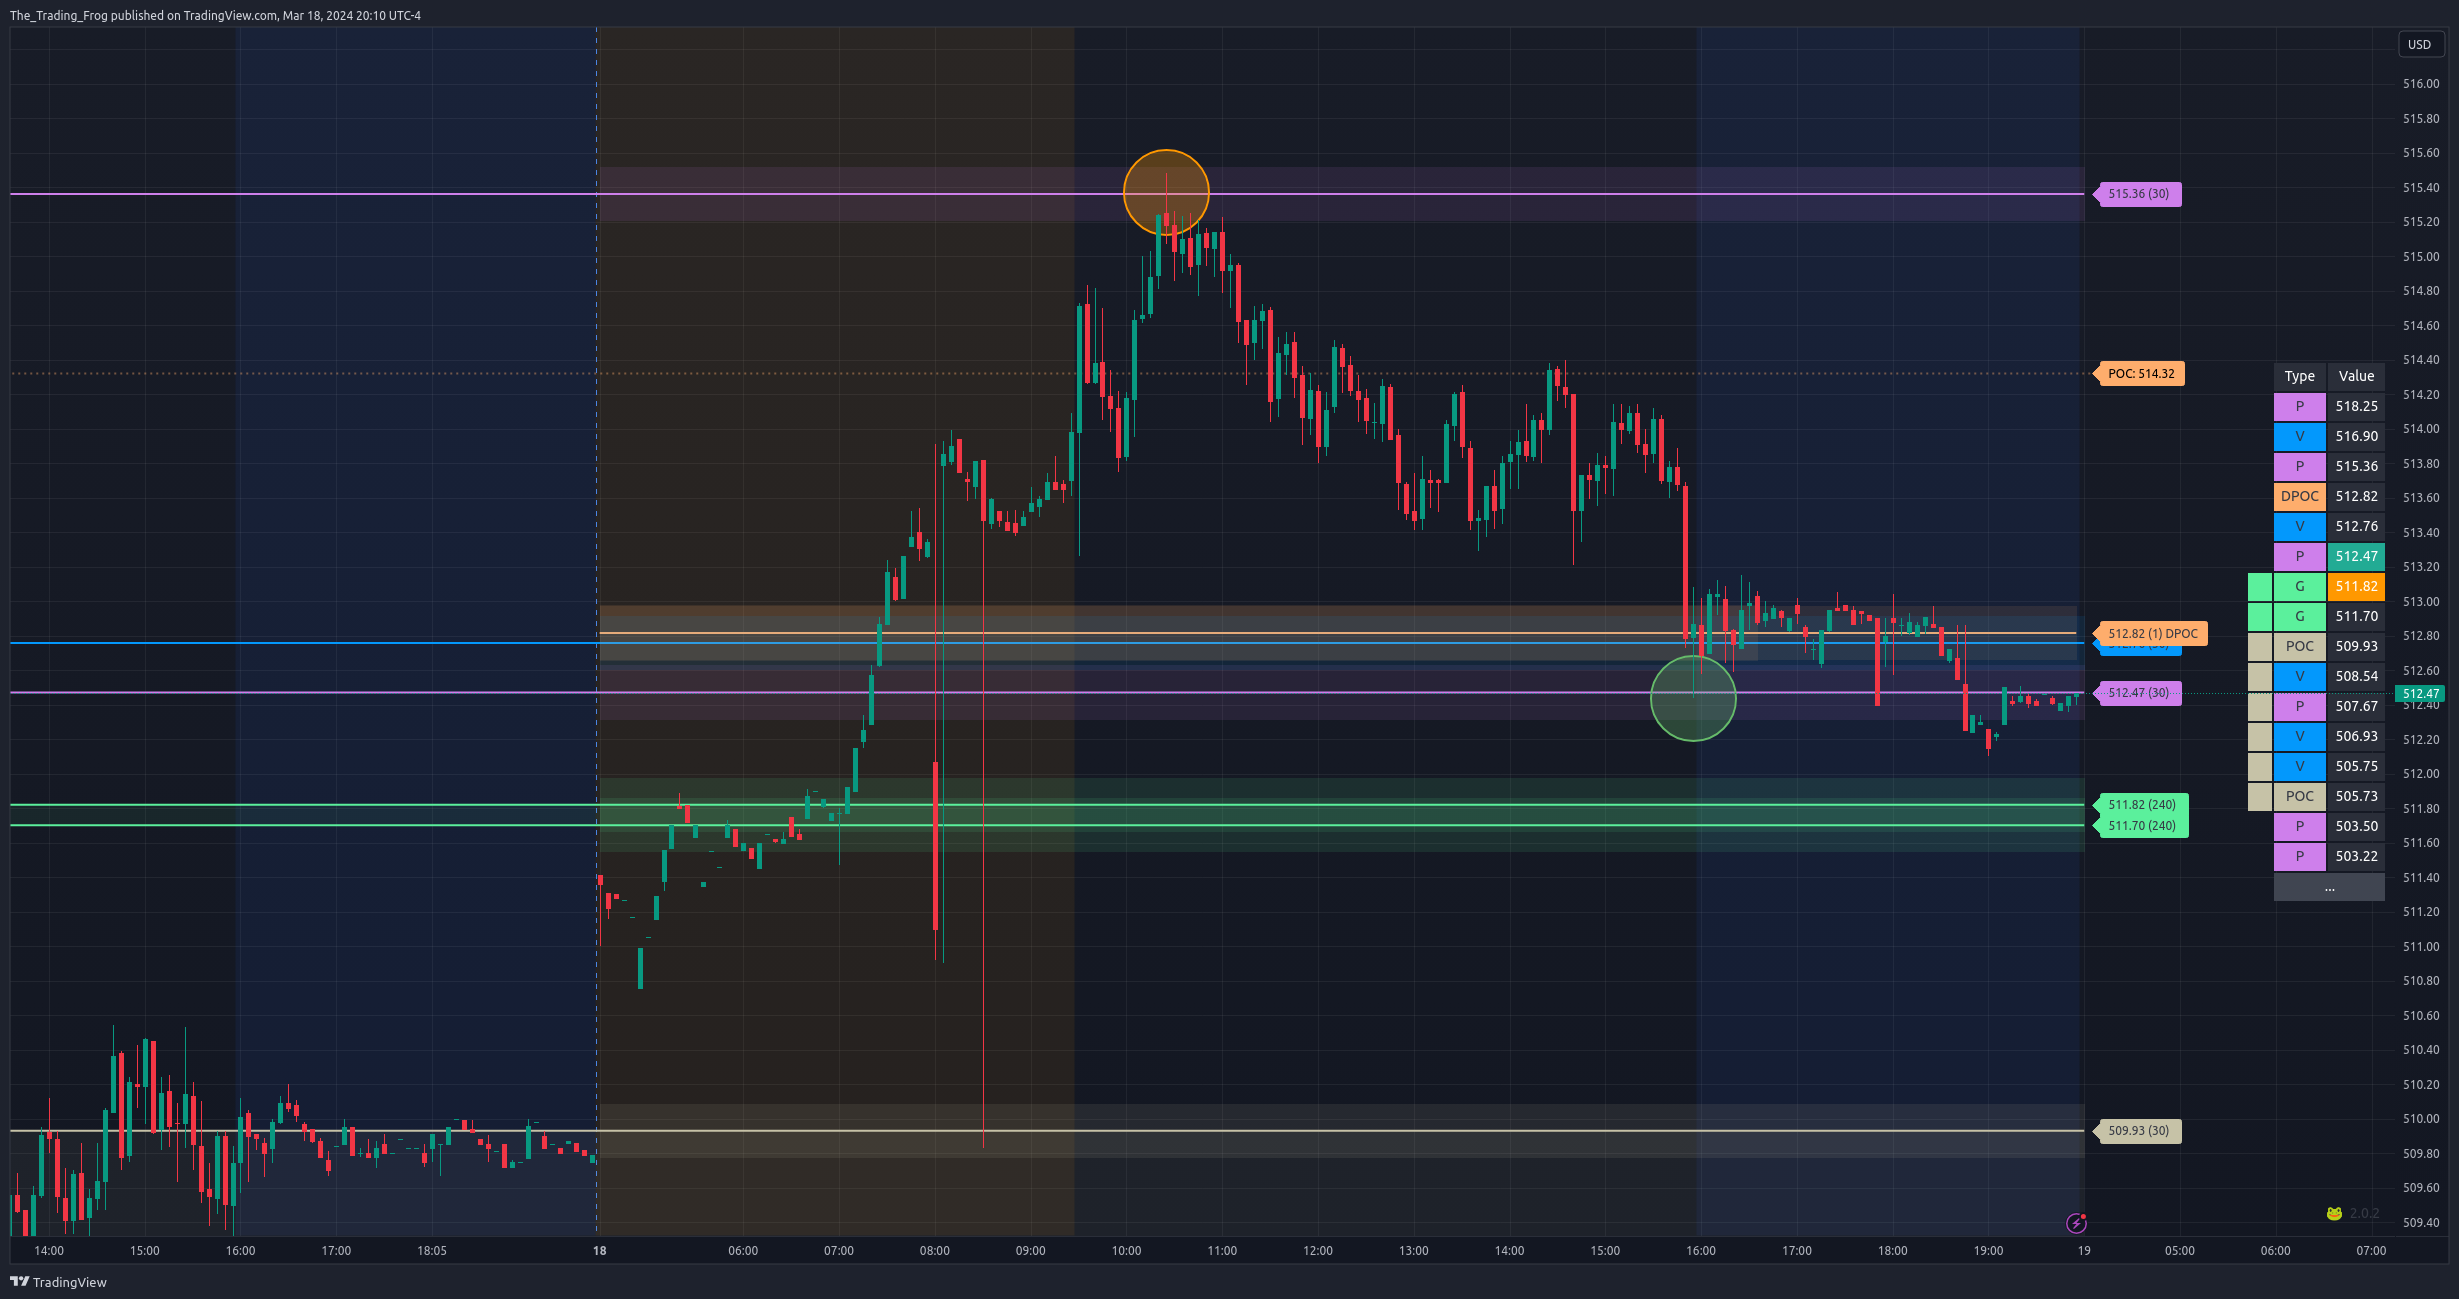
SPY - 2024/03/18: GAP Up
Here we saw a GAP up over night. Waiting until the price hit a level and then playing the reversal led to a large day long trade from one level all the way to the next.
NIO - 2024/05/01: Break and Retest
Here on NIO is another great example of a break and retest.
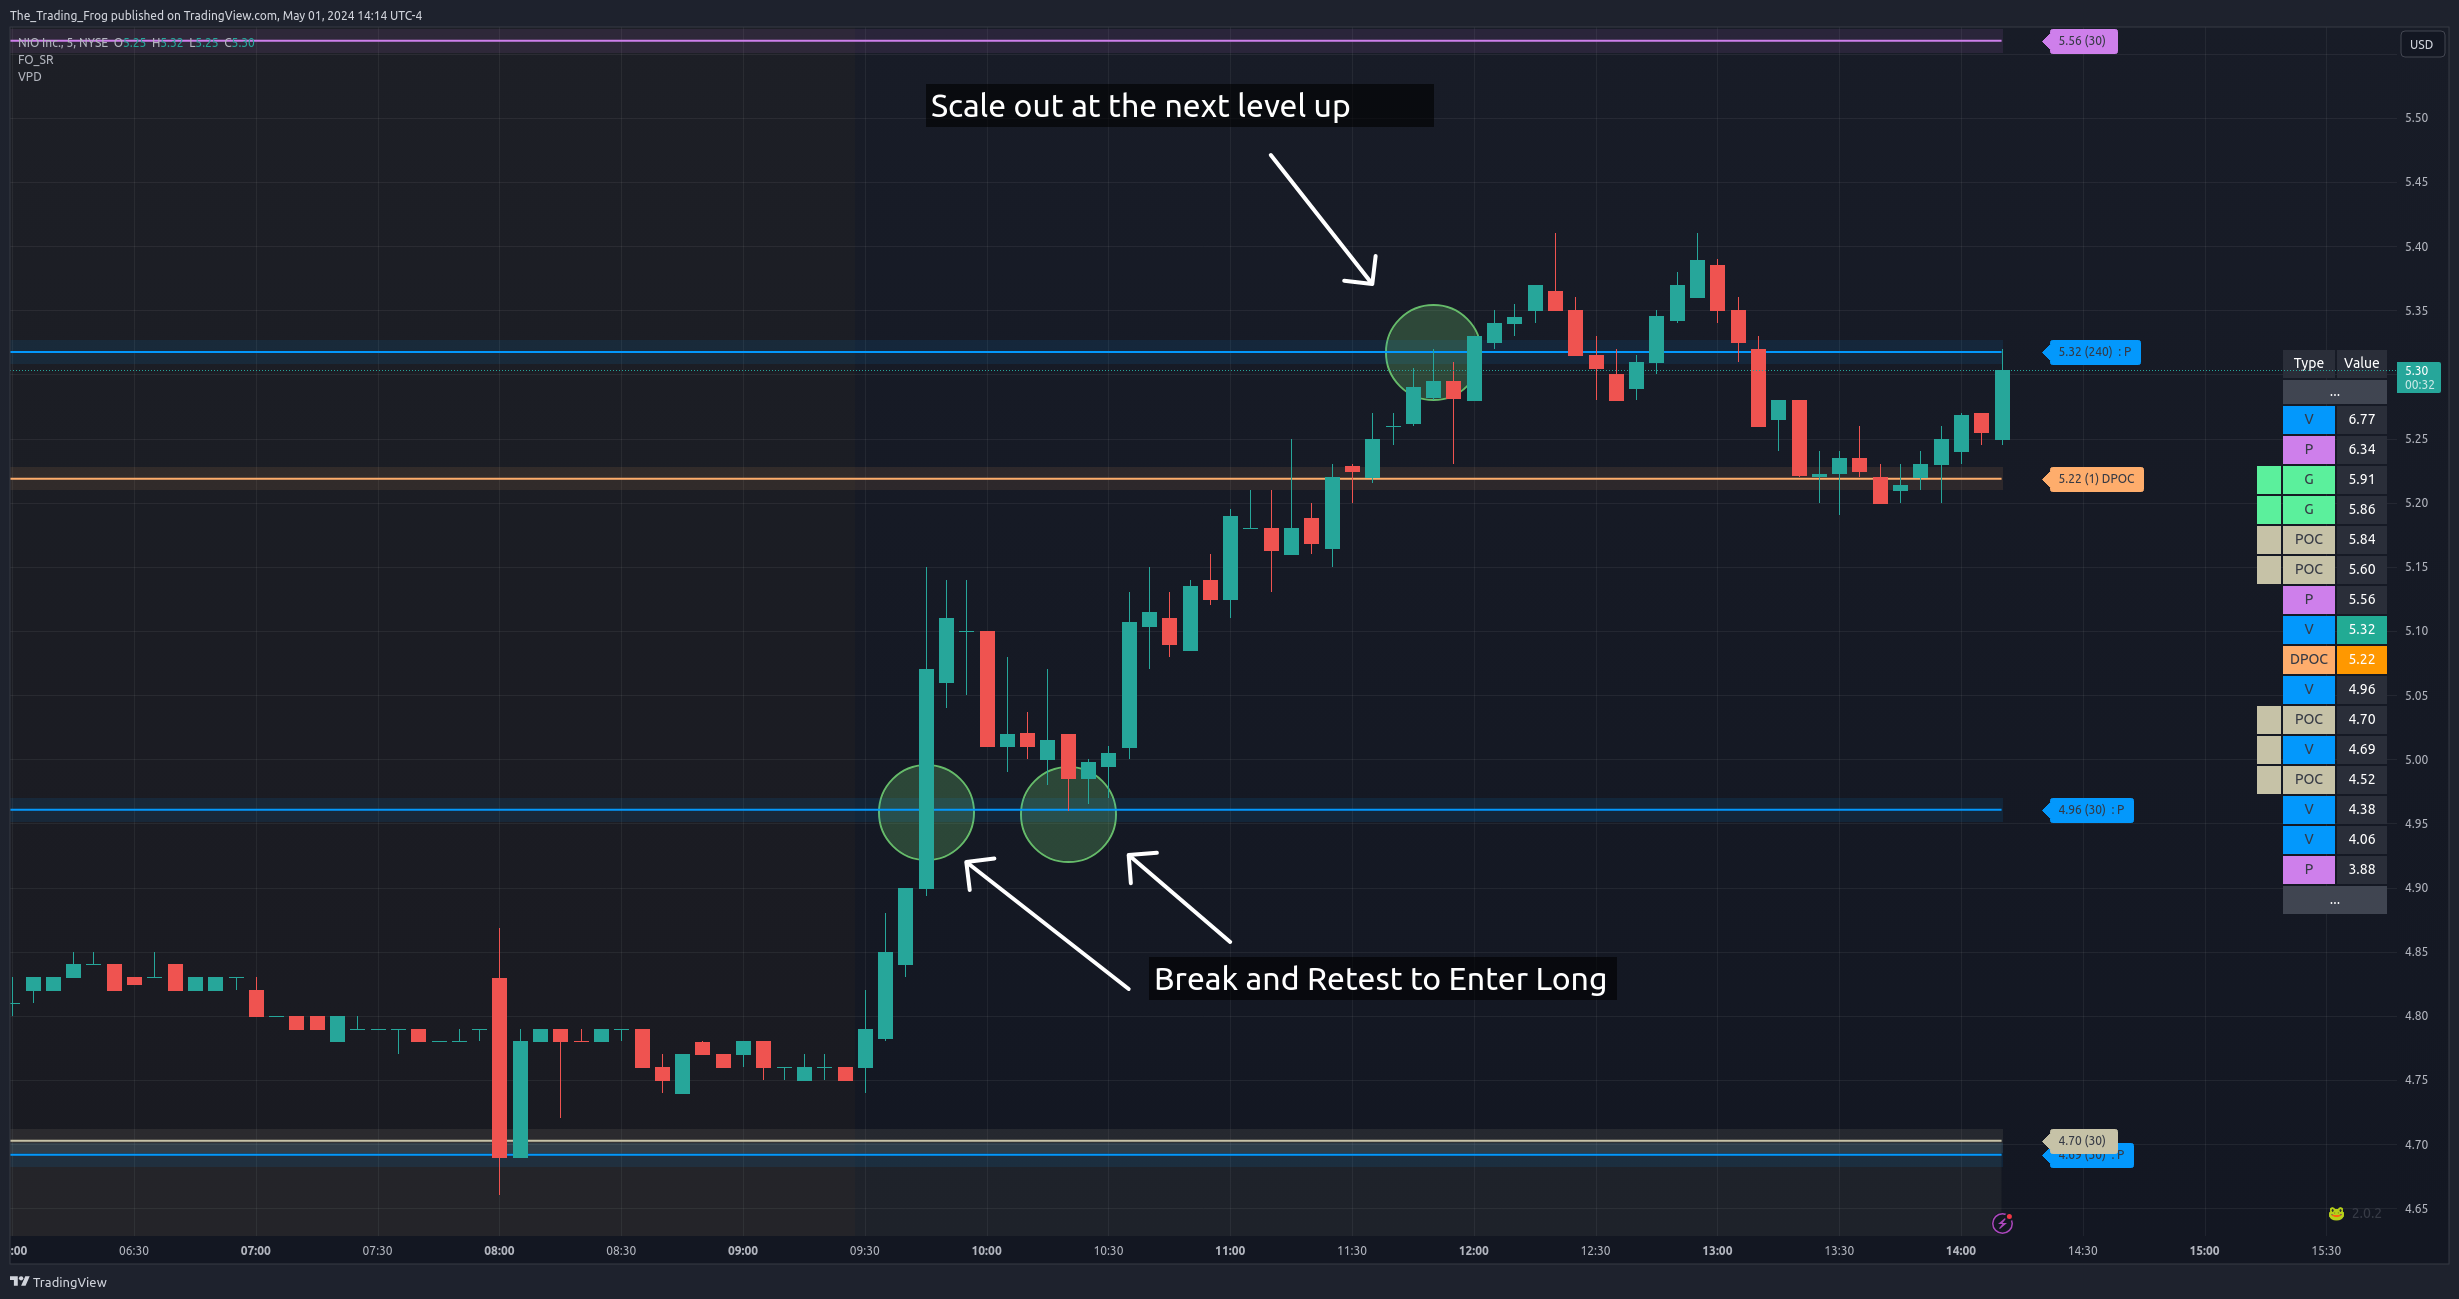
SPY - 2024/07/23: Simple SBR Trade
Simple (SBR) trade on SPY. Remember that you can also use trade vehicles like futures and trade of SPY levels. For this trade I used ES for the actual trade but the SPY chart to time entry.
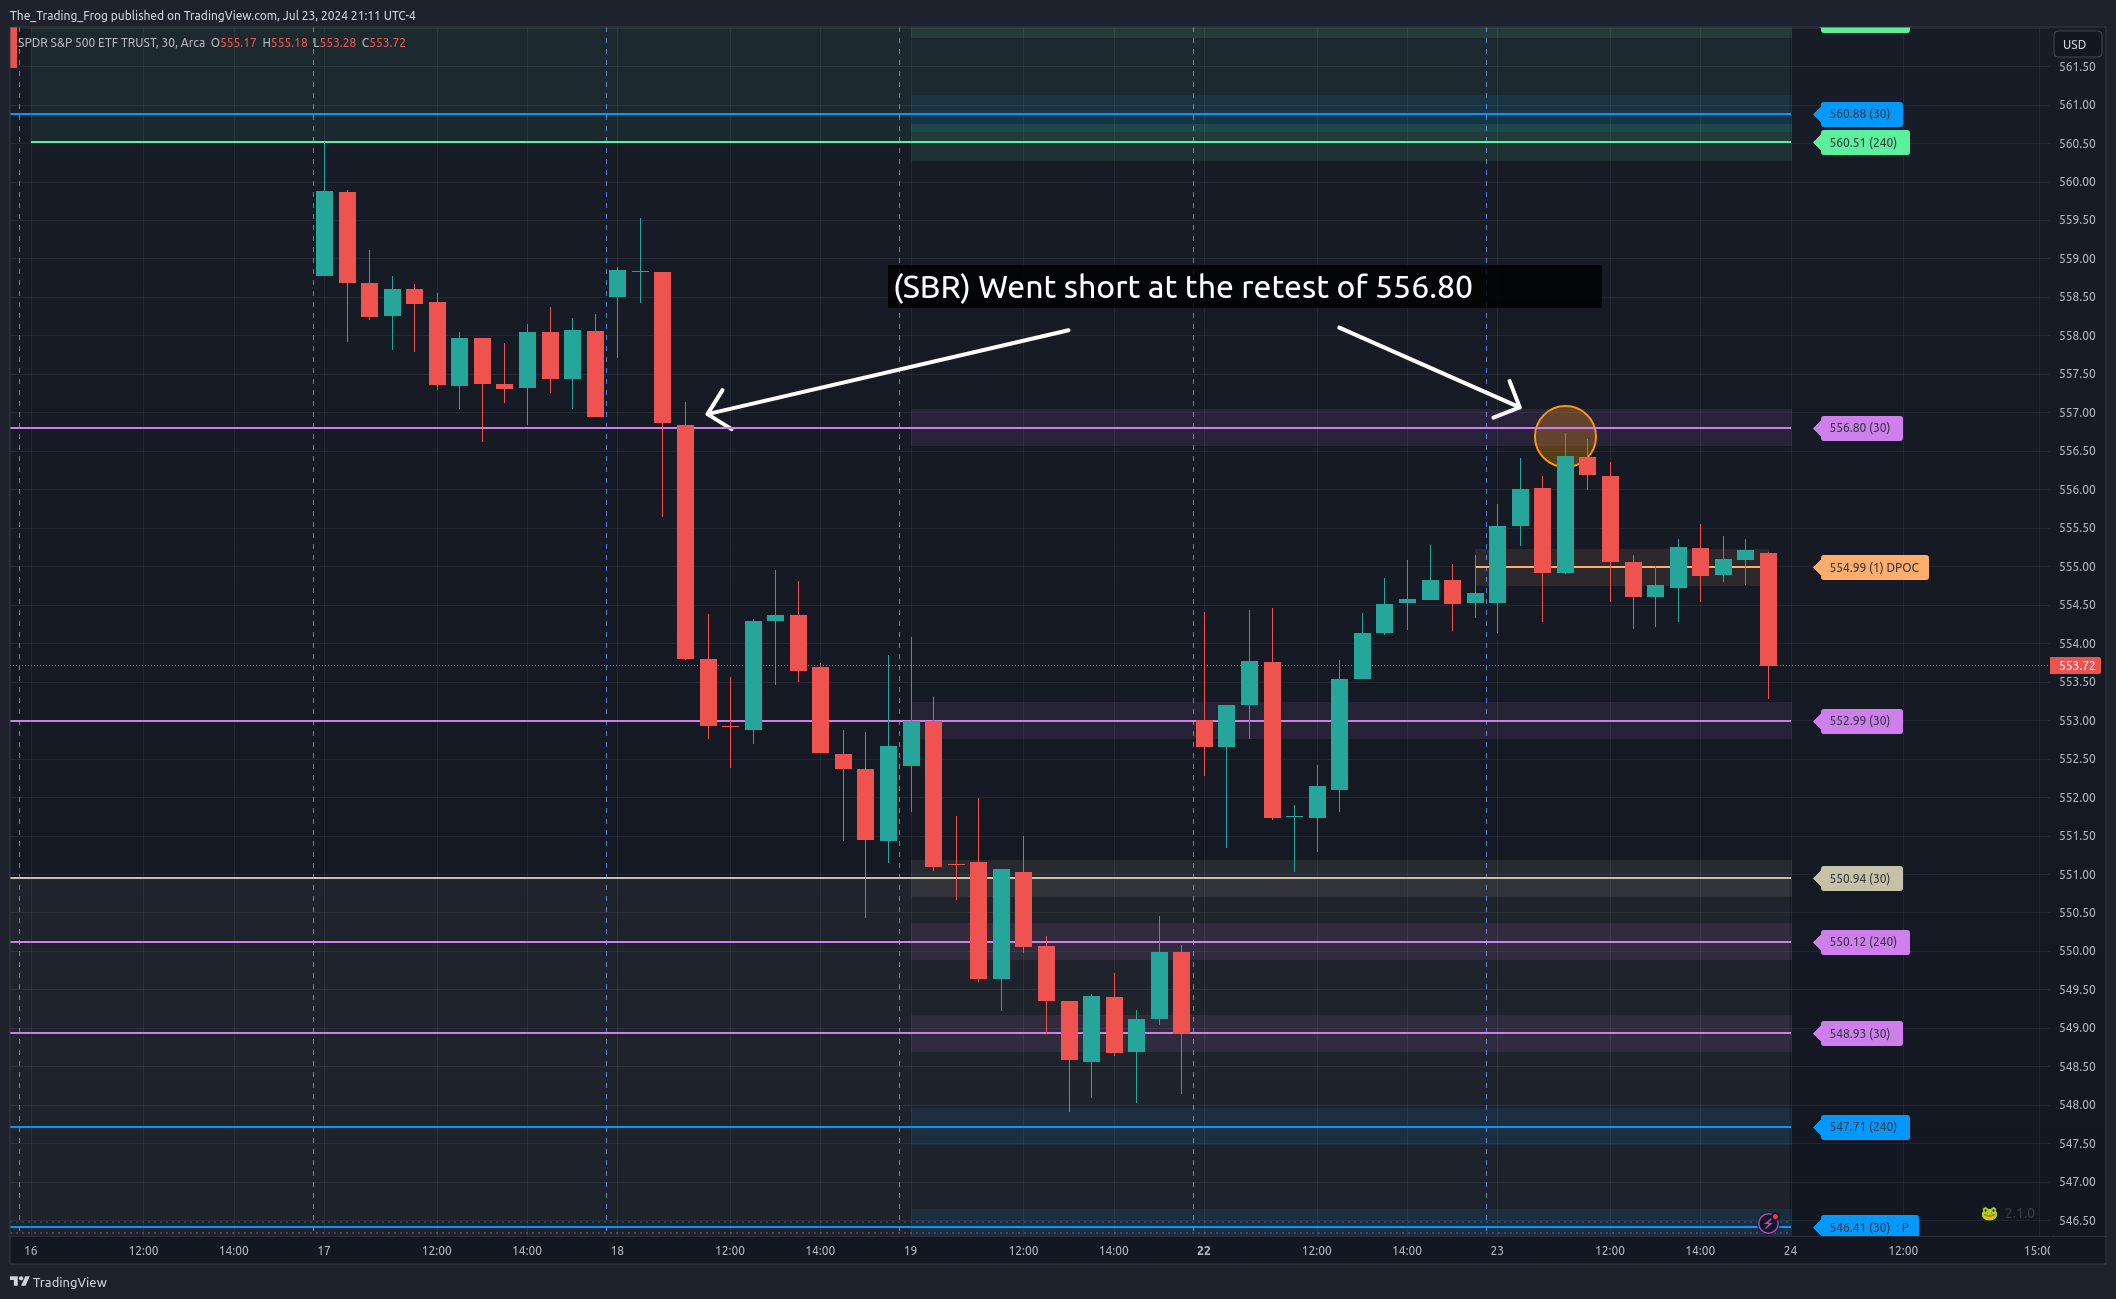
SPY - 2024/07/31: Two SBR Trades
Two (SBR) trades on SPY and a (GCR). Notice that on the second SBR the price action dropped below the level before quickly ripping back up. Ensuring you have proper stops that provide a little room for these fake-outs is very important. You can always add to a position after the reversal is confirmed.
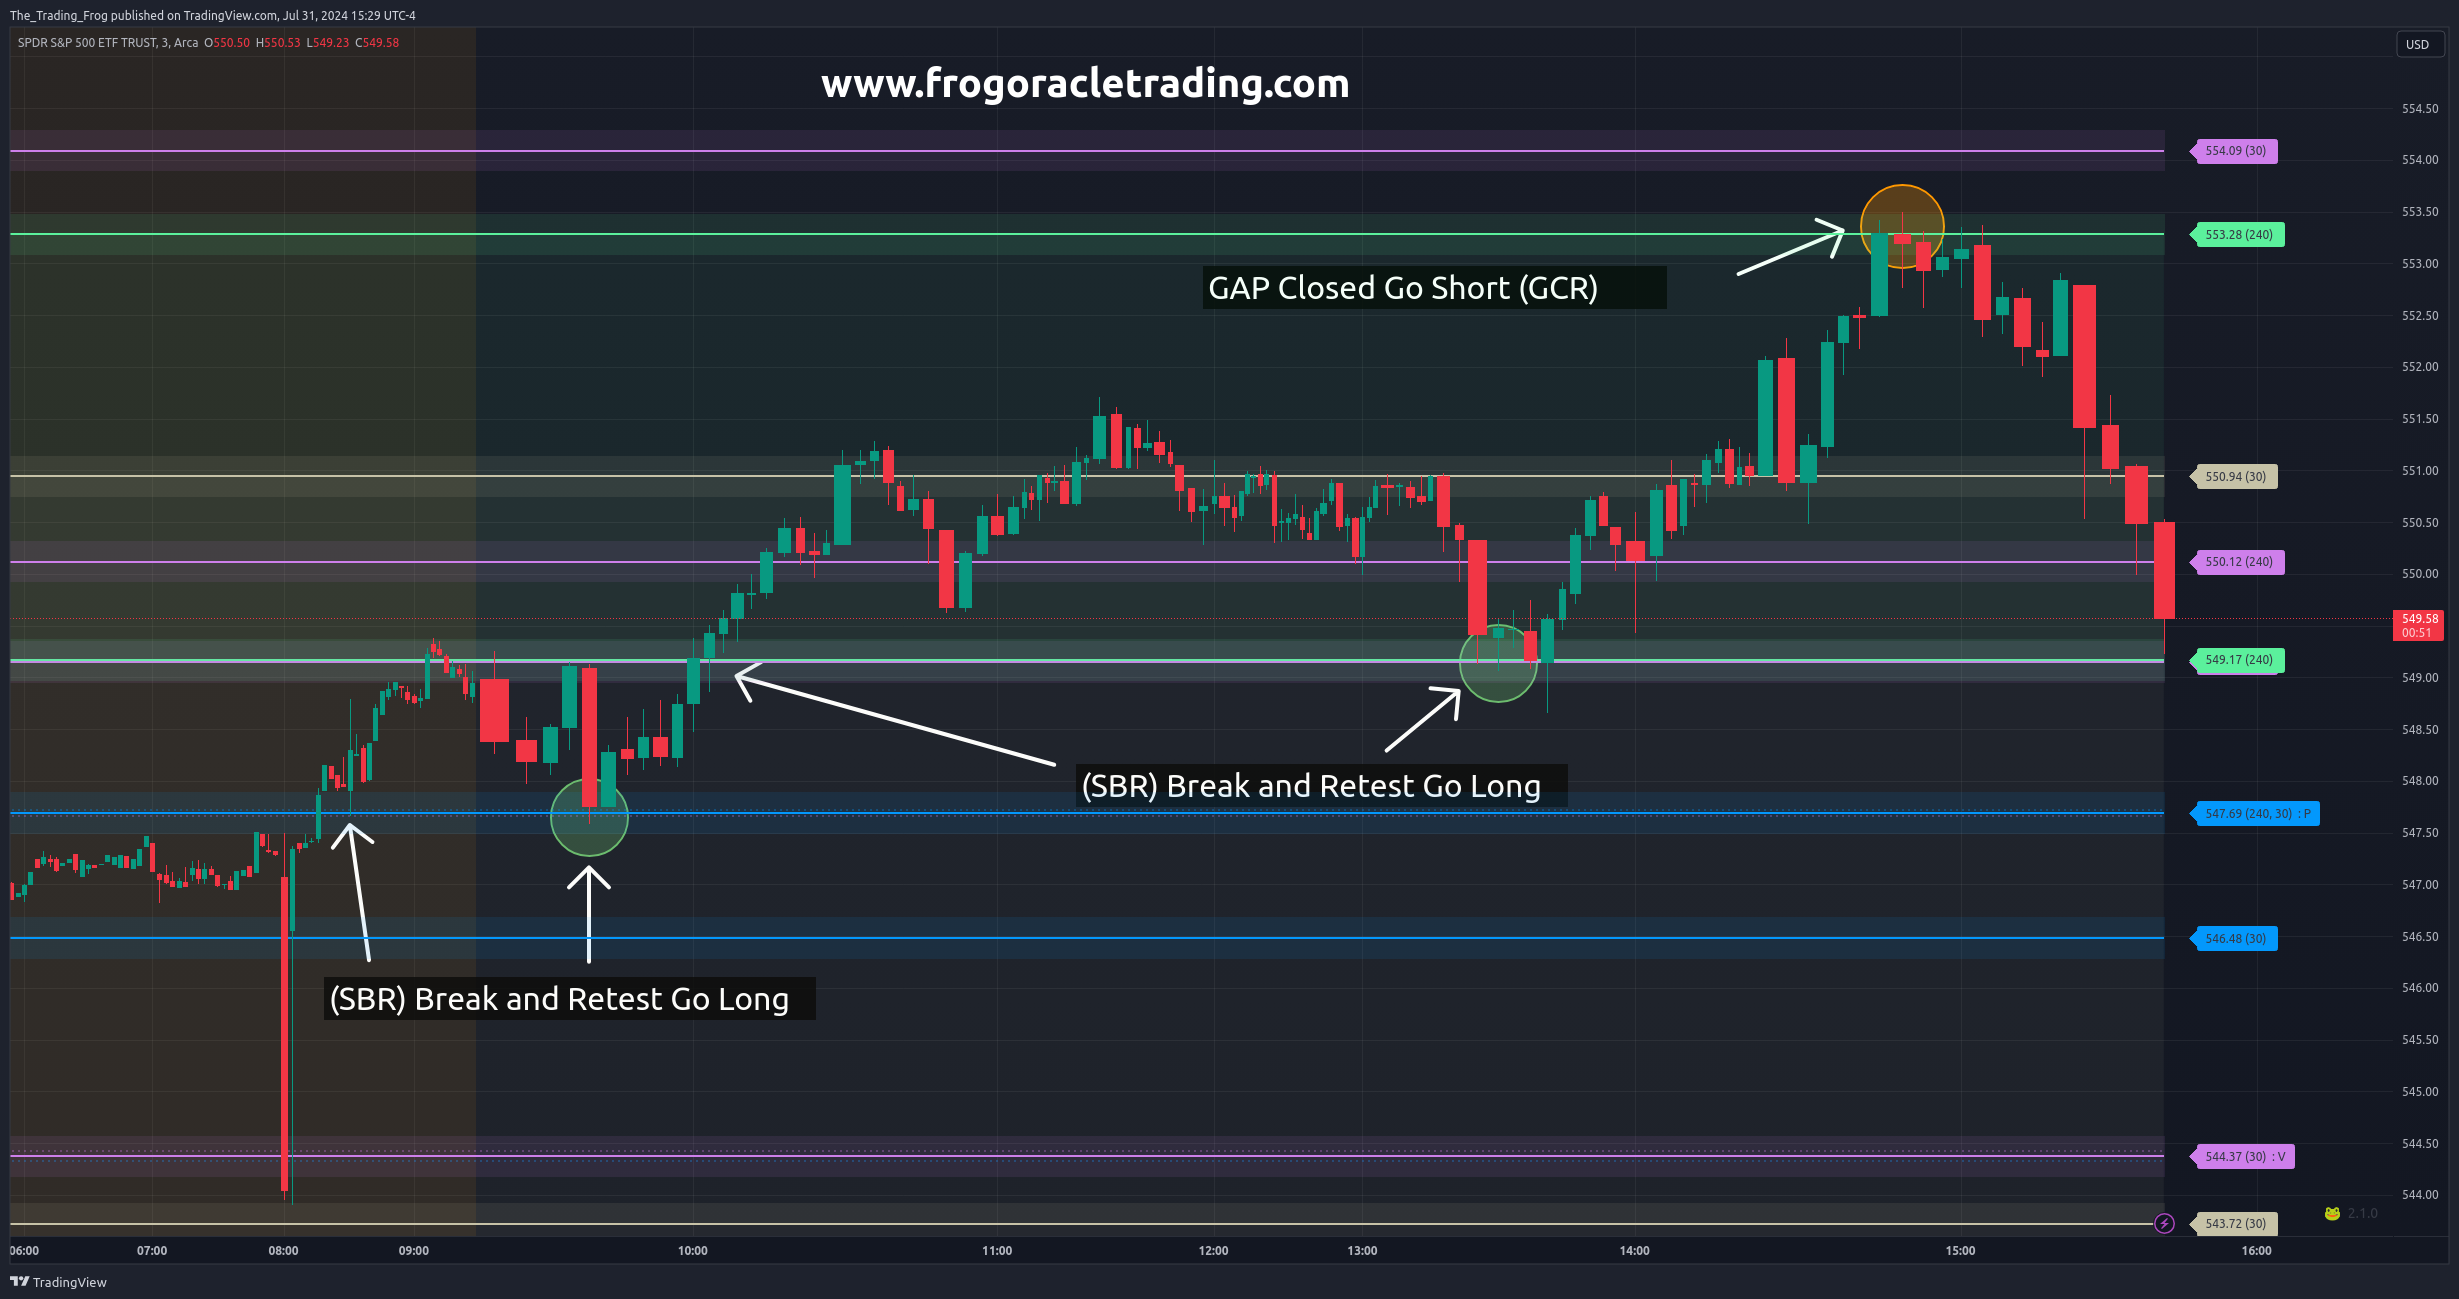
SPY - 2024/08/01: Trending Down
SPY trended down all day presenting many opportunities to enter using the (SBR) strategy.
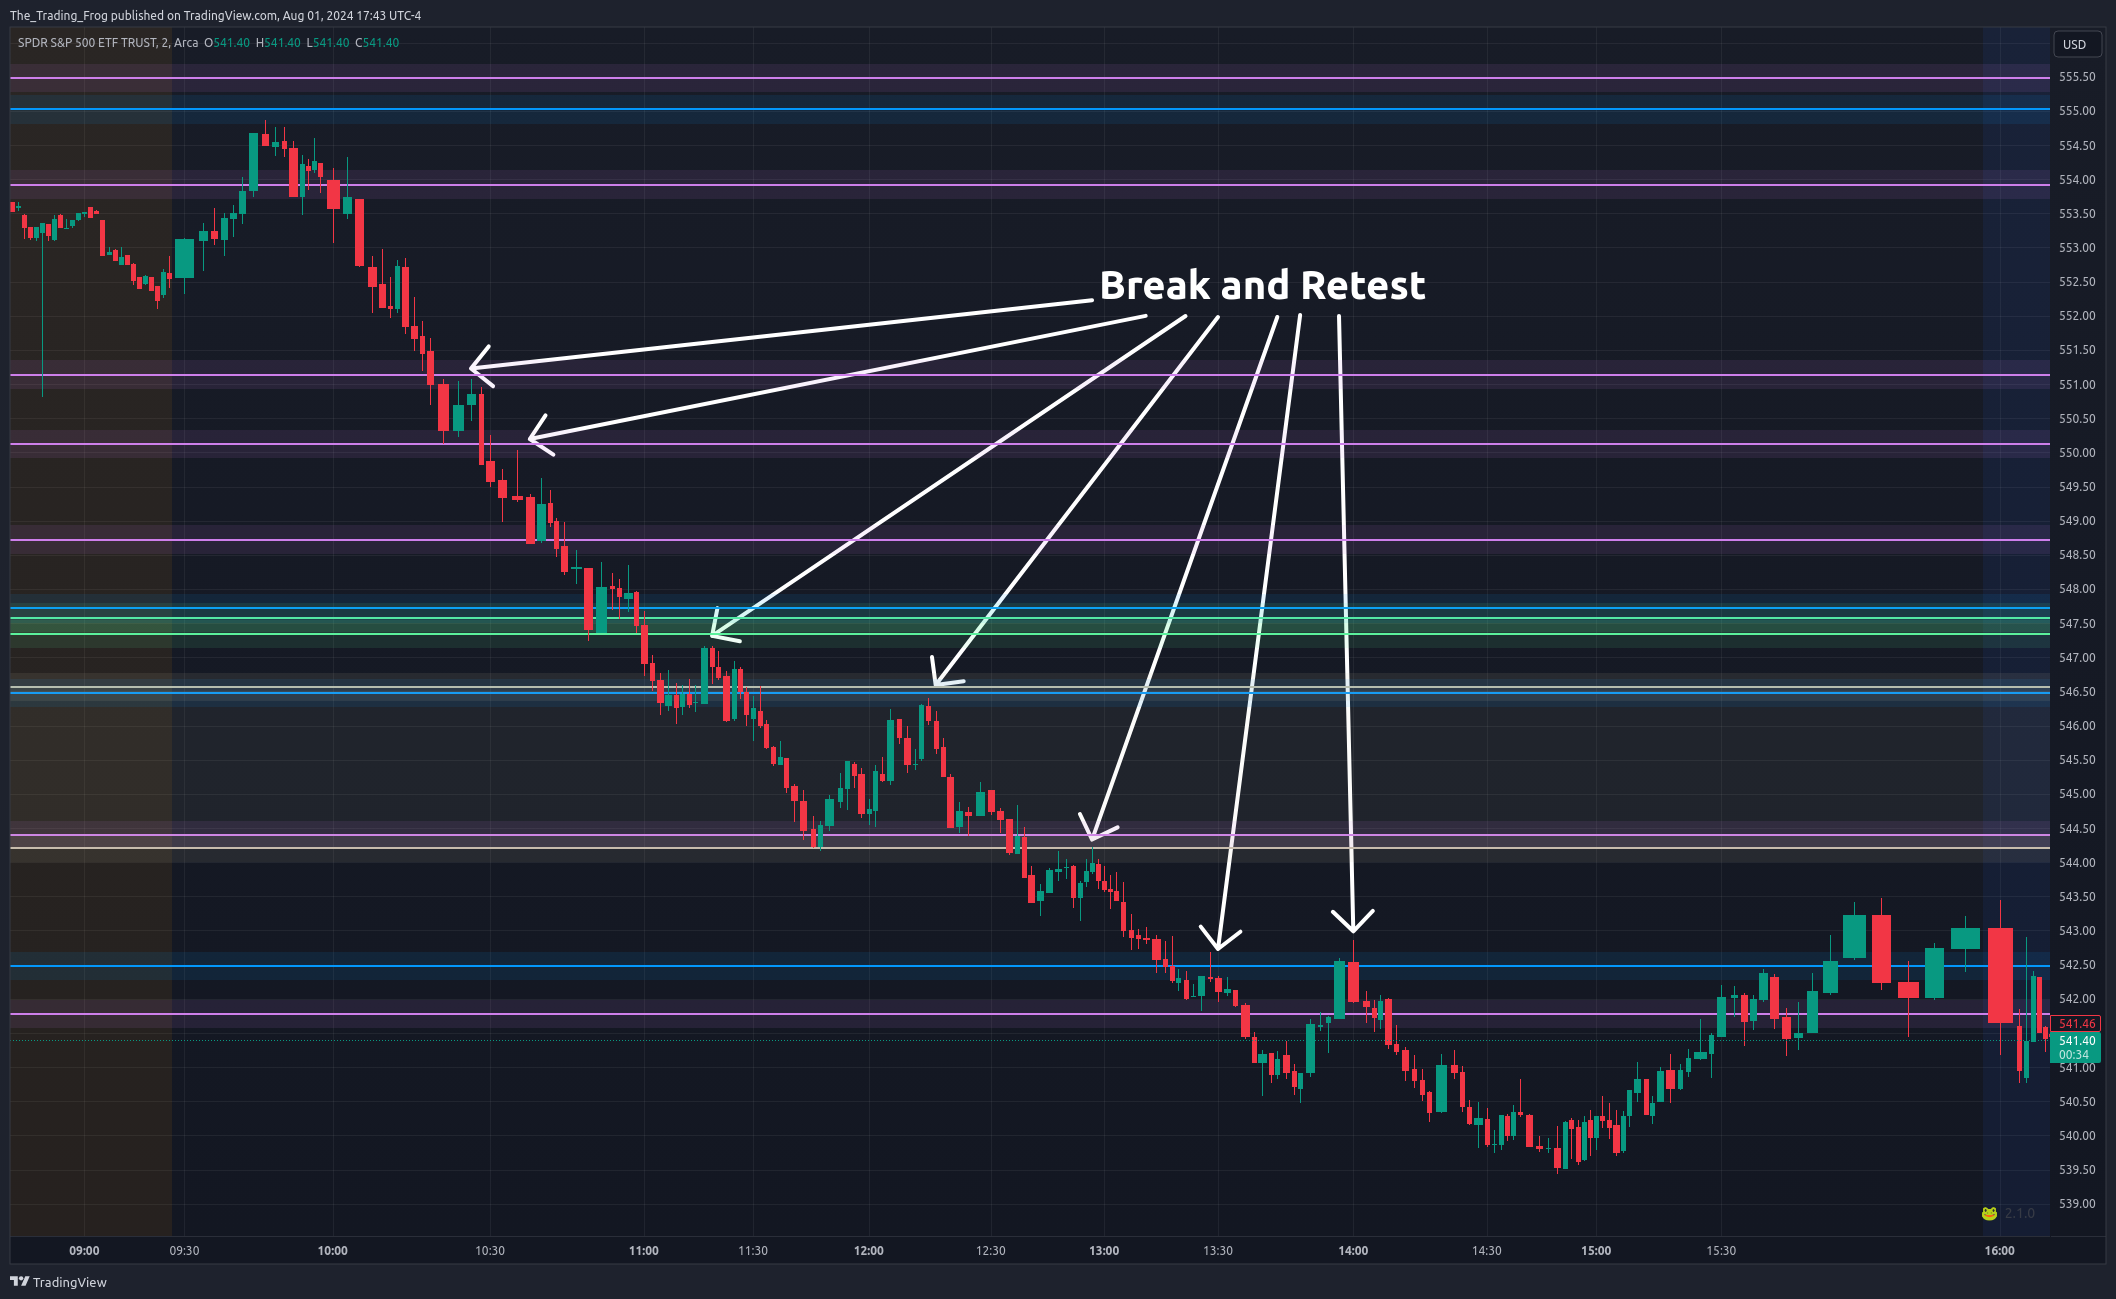
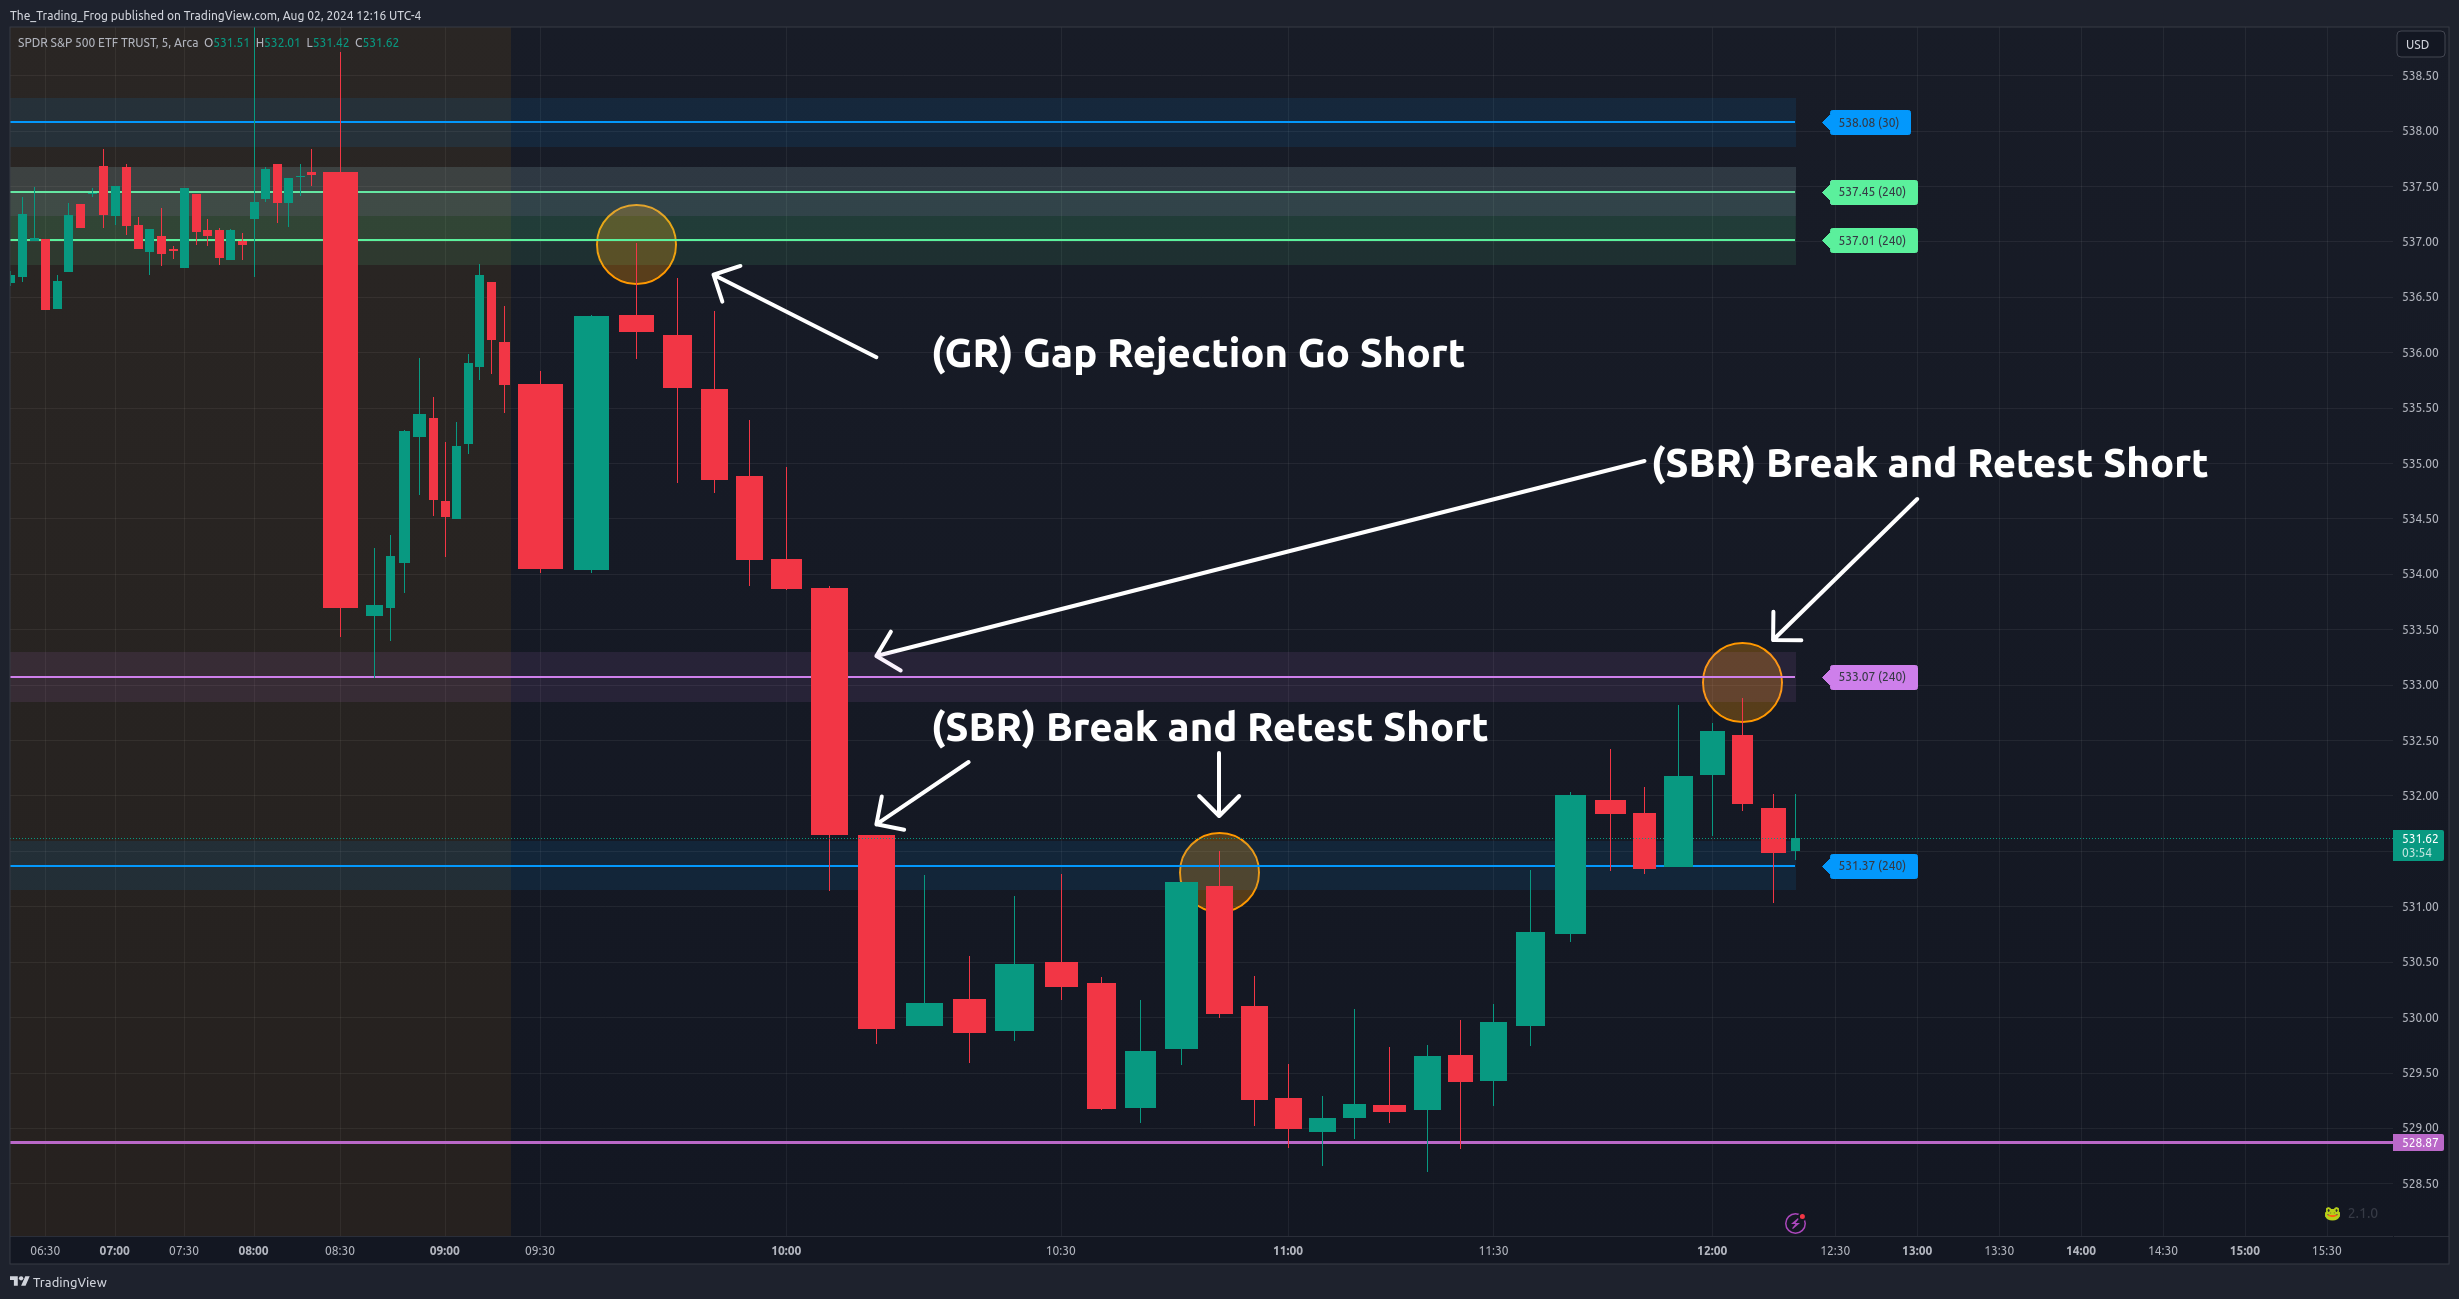
SPY - 2024/08/02: GR and SBR Trades
SPY presented a great example of a (GR) Gap Rejection and two (SBR) Support / Resistance Break and Retest trades.
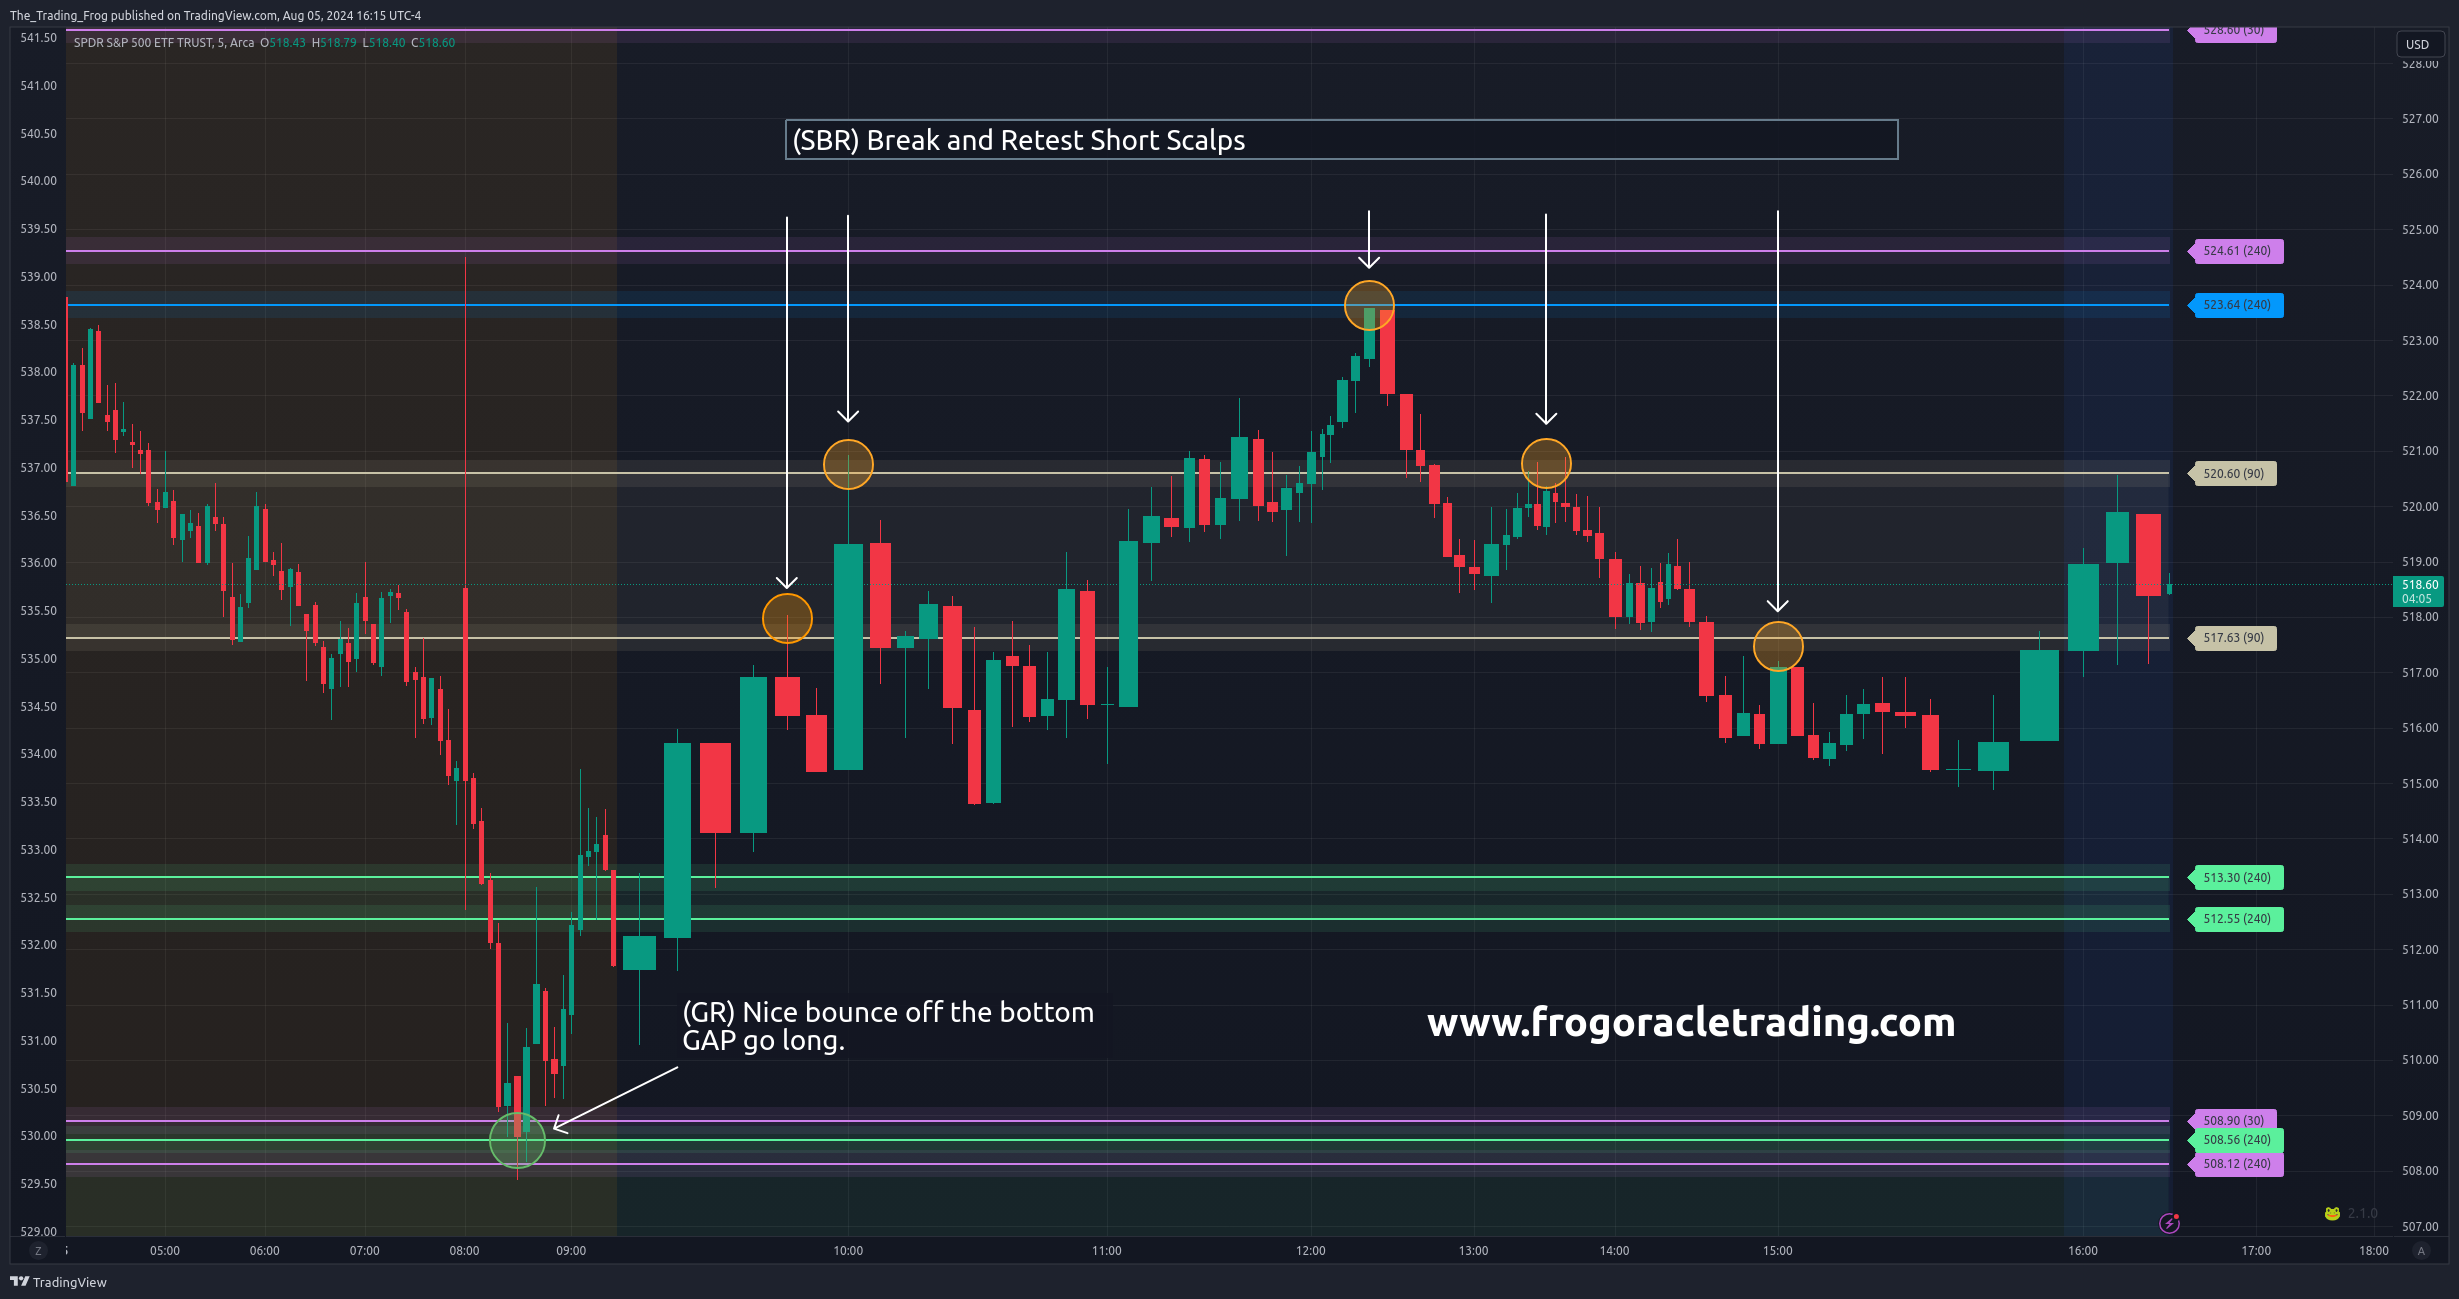
SPY - 2024/08/05: GR and SBR Trades
After a large overnight drop there was a (GR) long play pre-market. Followed by several (SBR) short scalps throughout the day as levels were back-tested.
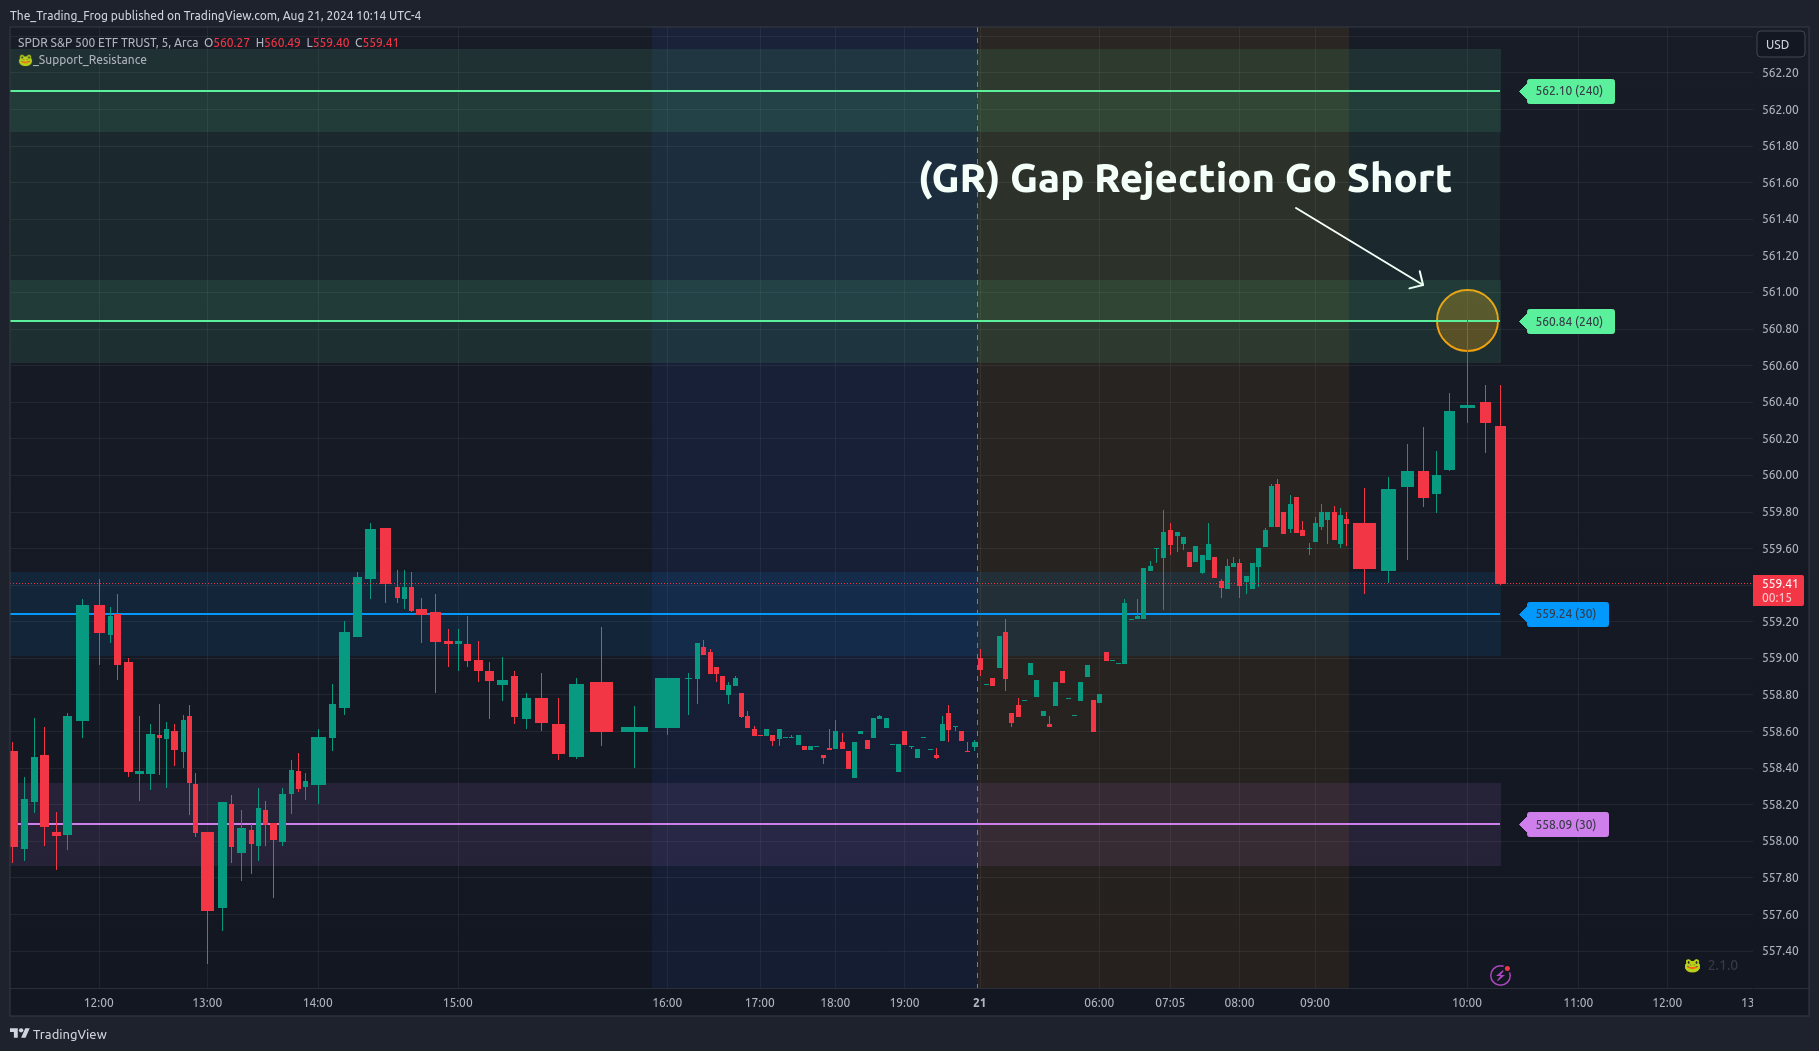
SPY - 2024/08/21: GR to Short Side
Excellent example of a (GR) to the short side.
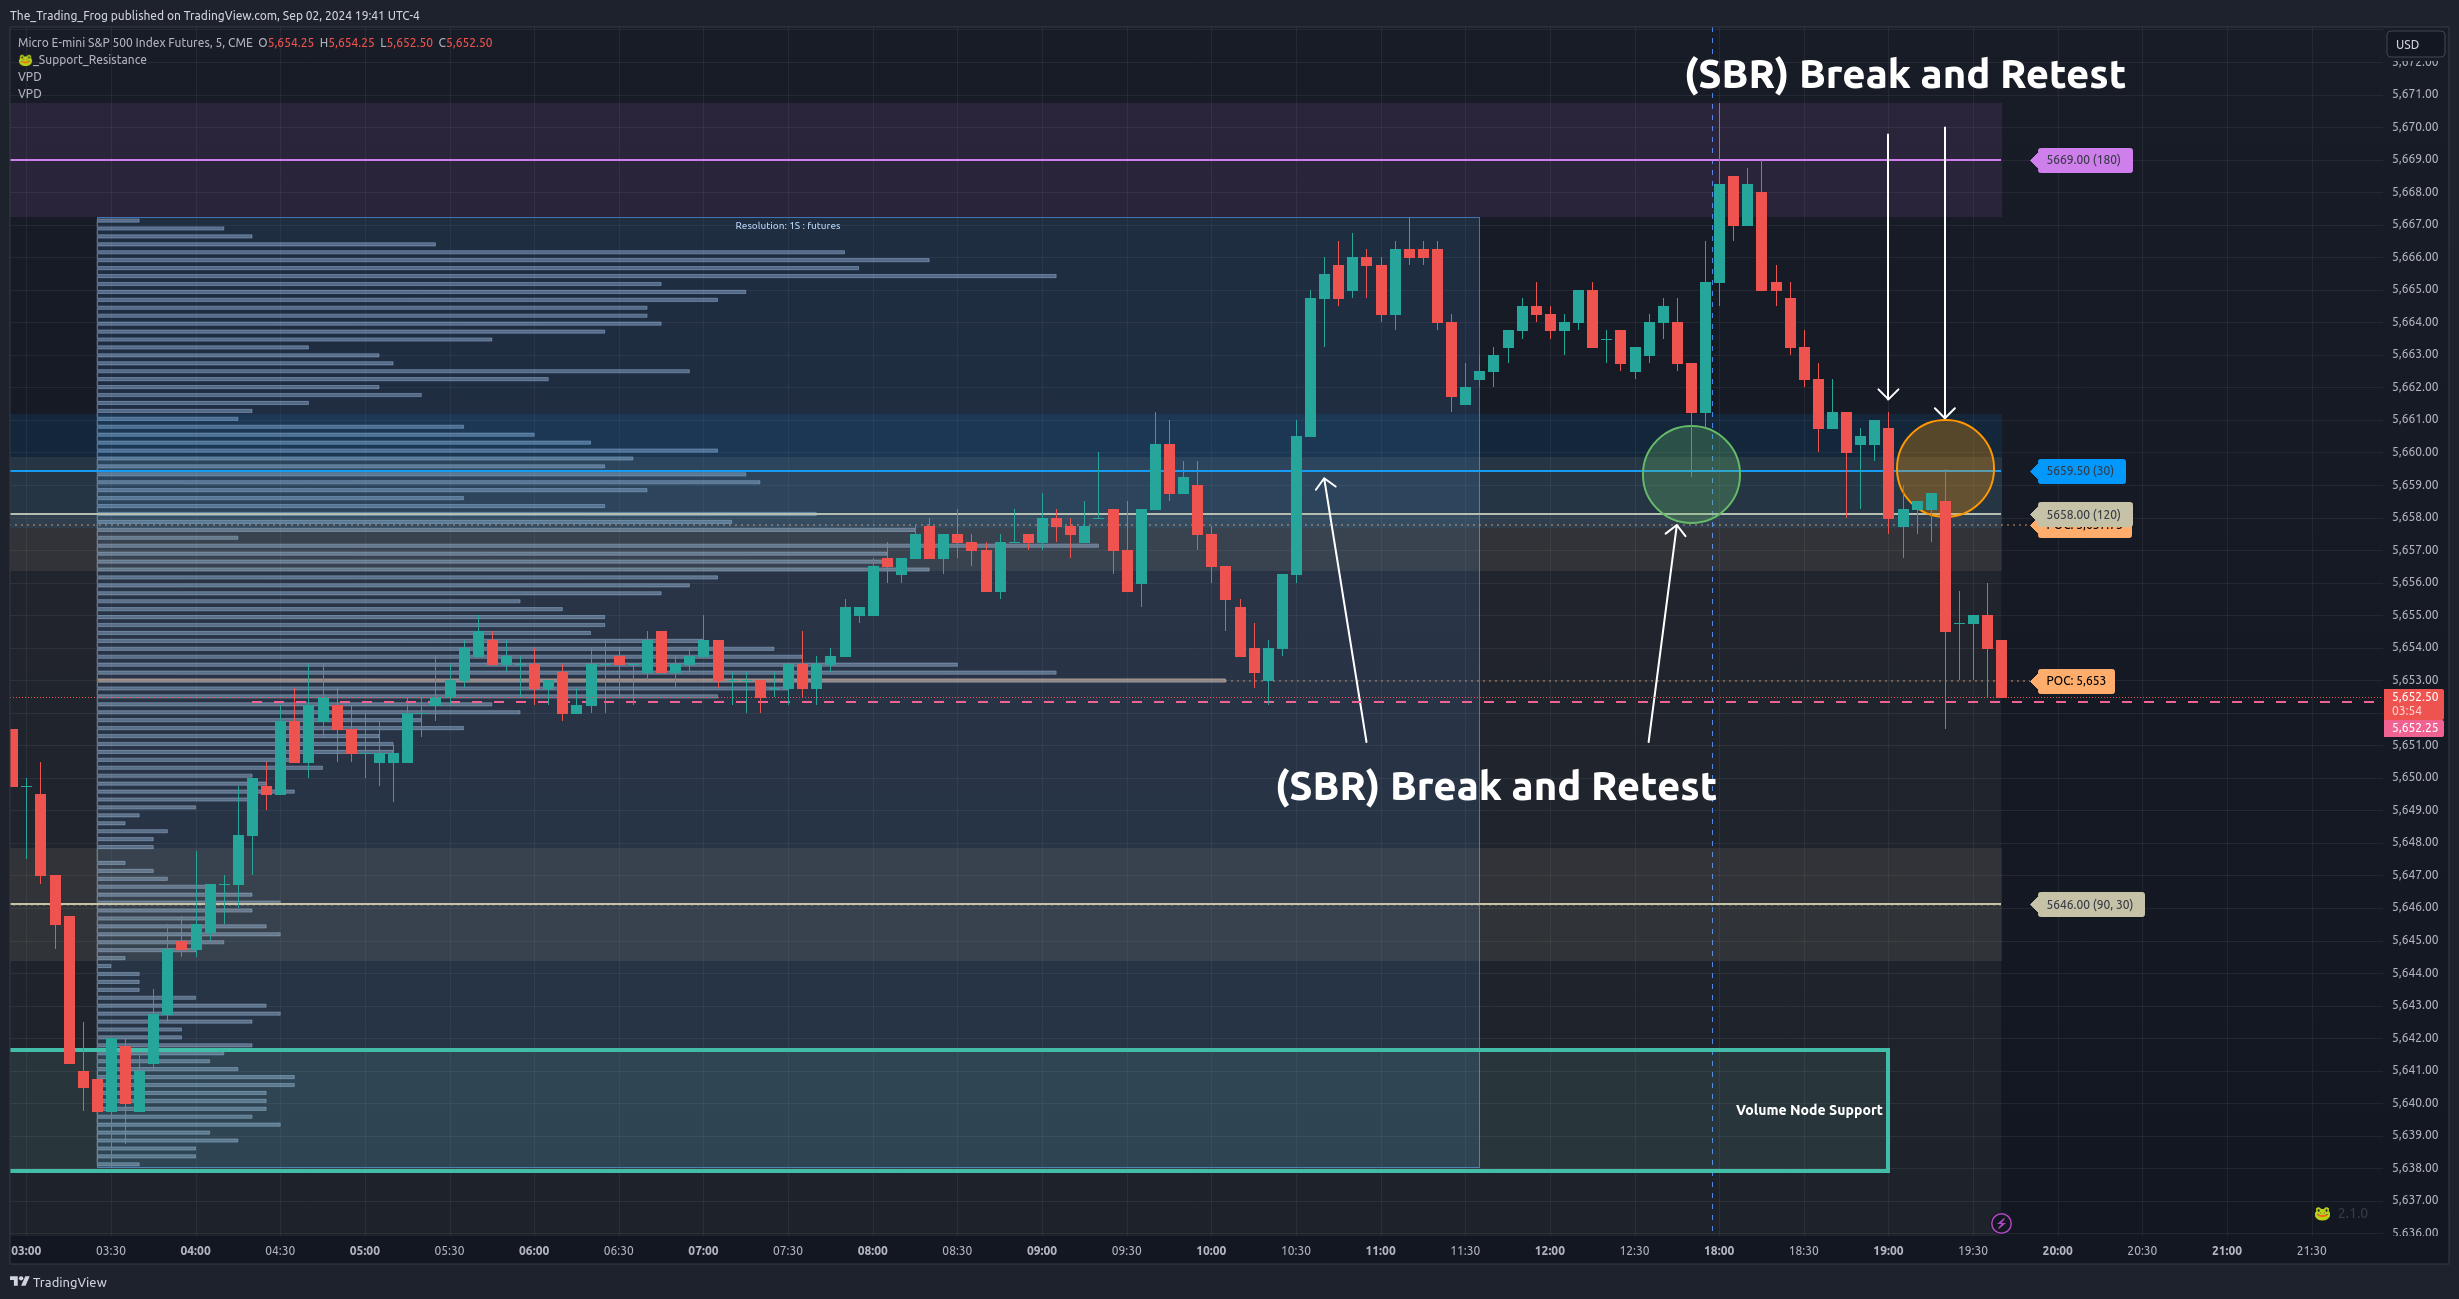
MES (Micro E-mini S&P 500) - 2024/09/02: Two SBR Trades
This chart shows two clean (SBR) trades on ES futures including using the volume profile to find an area of support to scale out of the short trade.
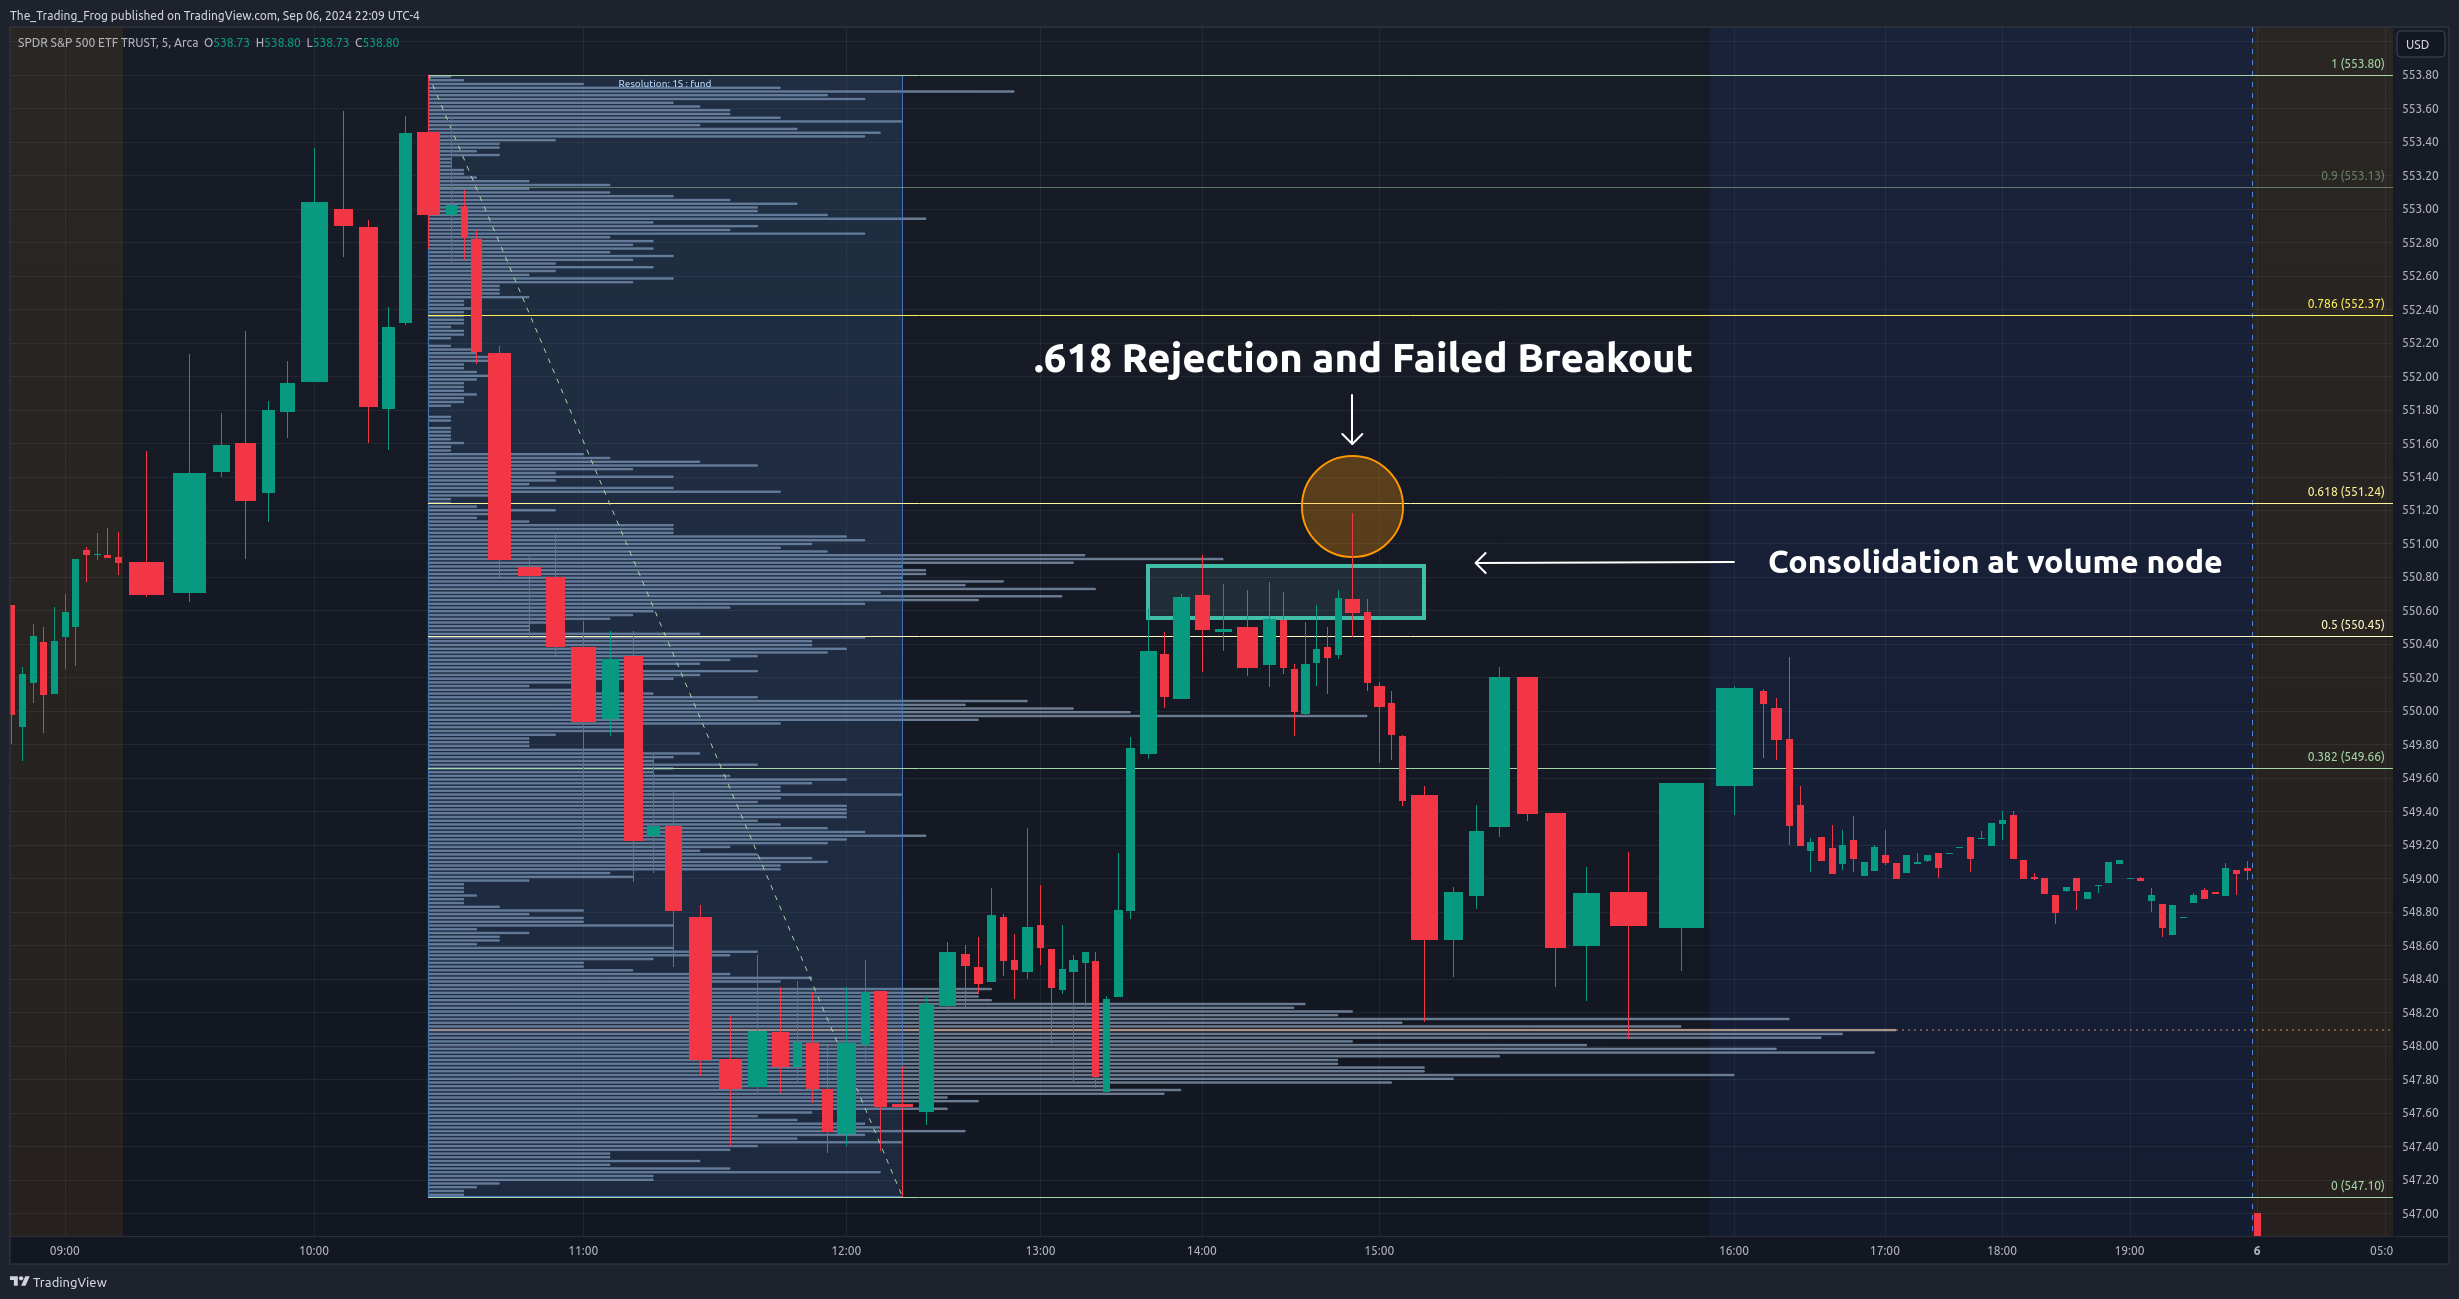
SPY - 2024/09/05: Fib Golden Zone Reversal + False Breakout
Here is a very clean Fib Golden Zone Reversal (GZ) + False Breakout (FB) trade. Look at the strong wick down right at the .618 level after pushing through the previous pivot made at the volume node. A quick liquidity grab before reversing to the downside.
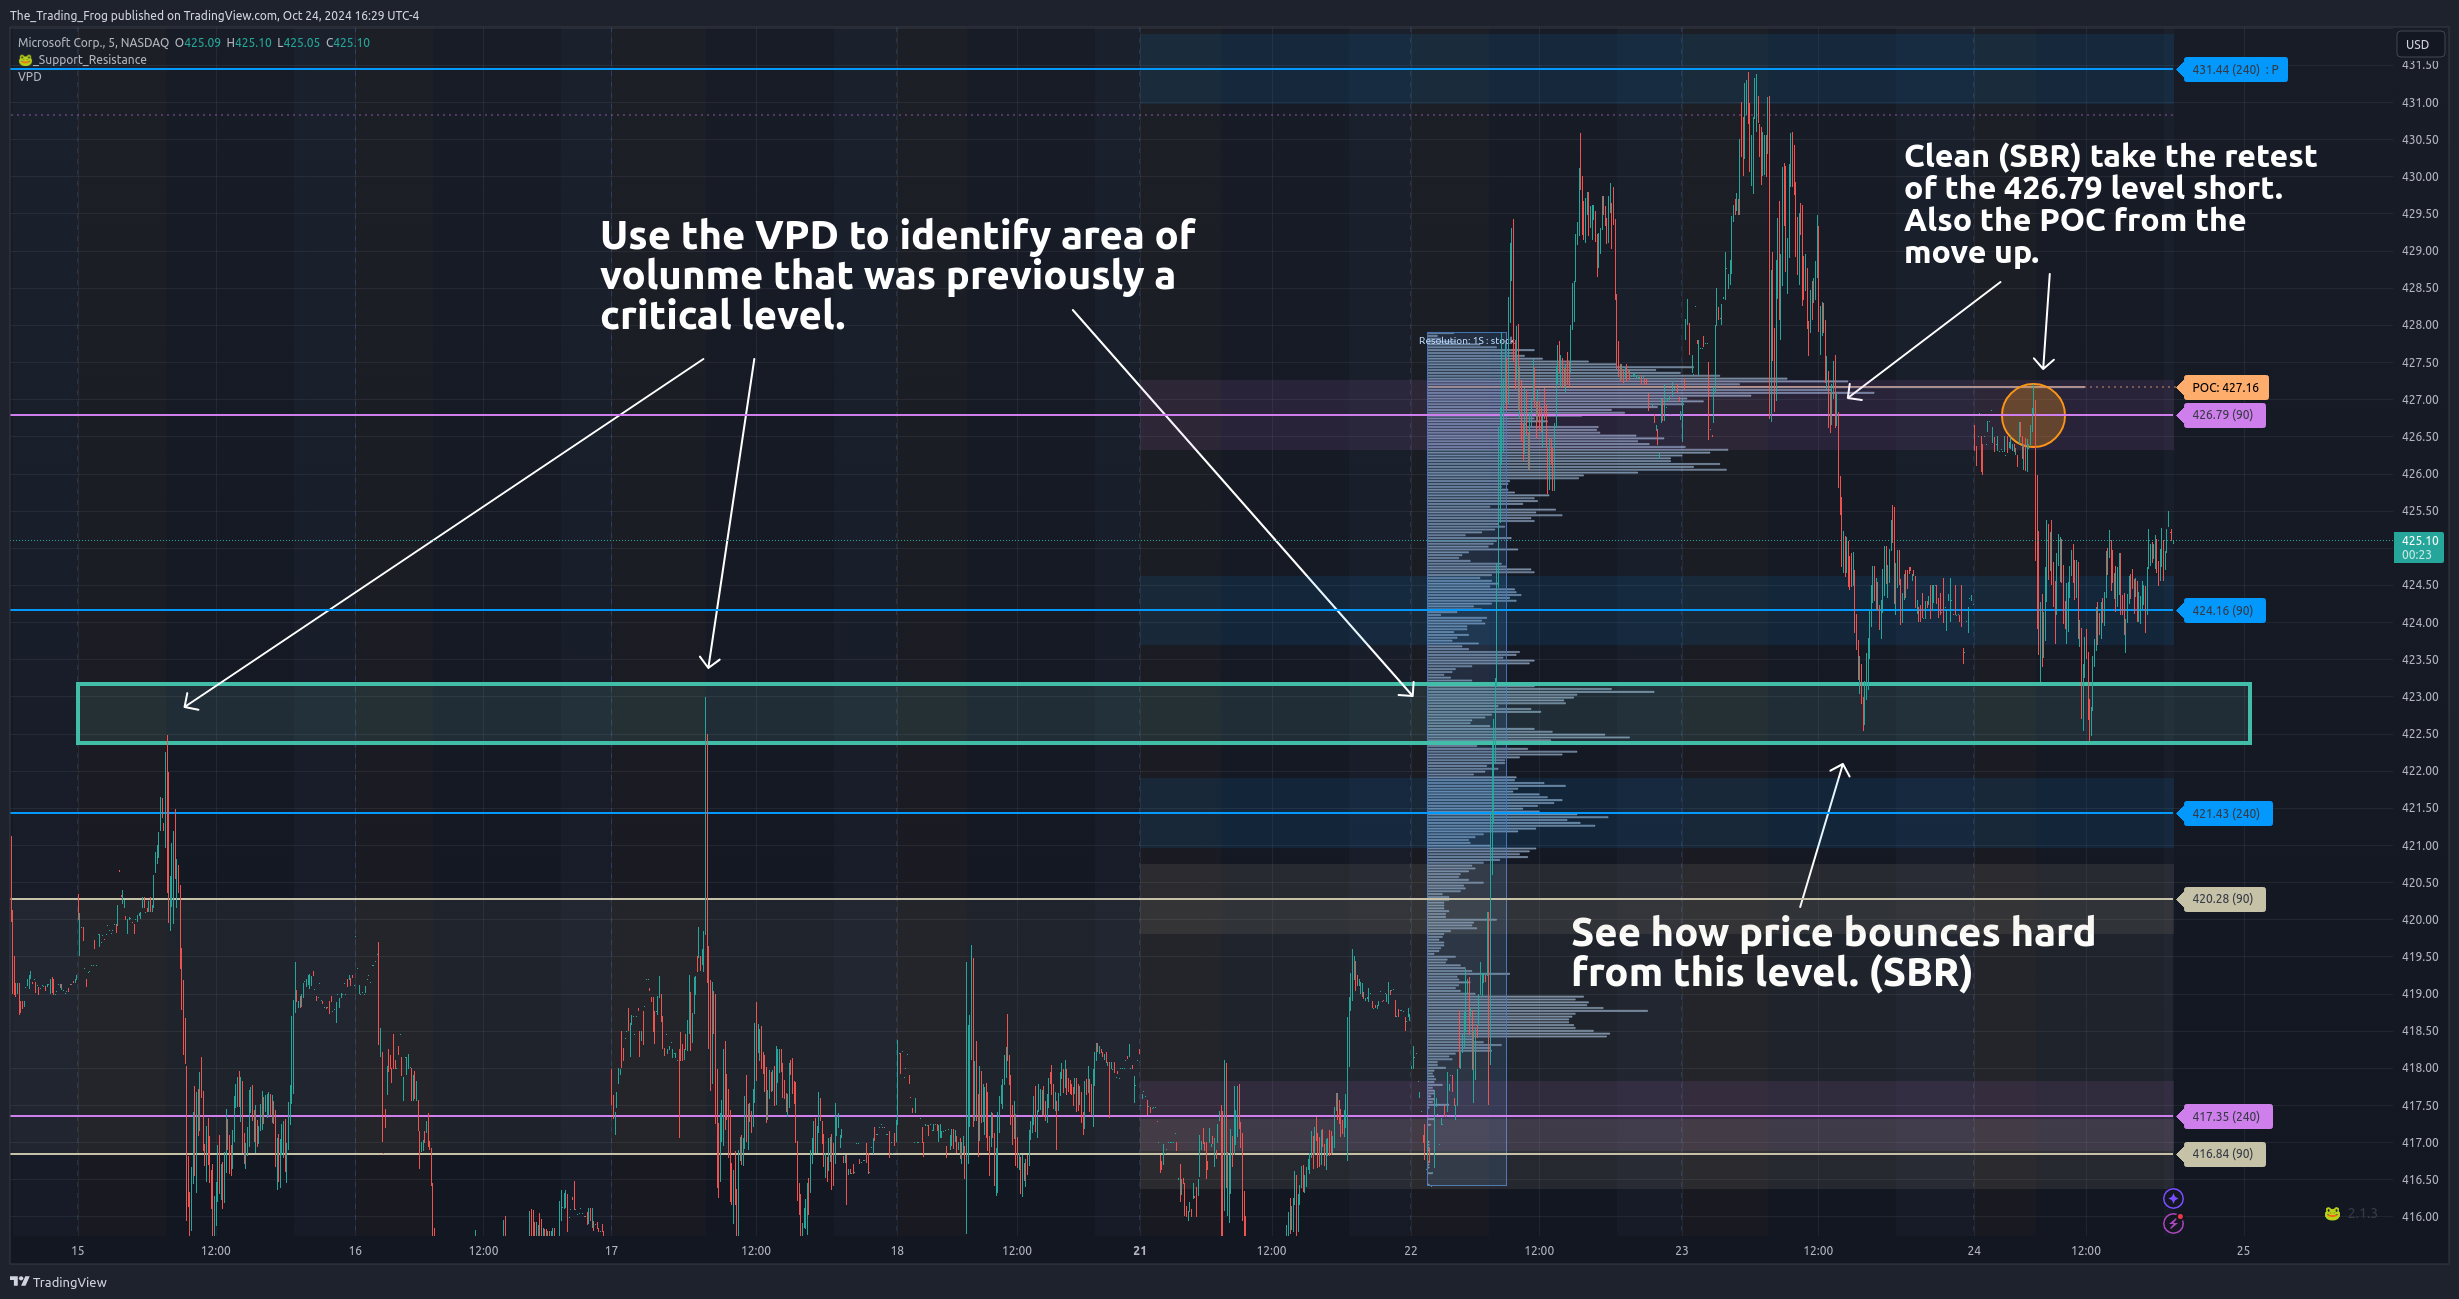
MSFT - 2024/10/23 and 2024/10/24 Several Setups
This chart shows two trades. The first uses the VPD and previous wicks to establish an area where resistance has become support. Trading long from a pullback into the green box results in a create trade to the upside. This area also aligns to the fib golden zone, however, this is not shown on the chart for clarity. The second is a trade short at the Retest of the 426.79 level.
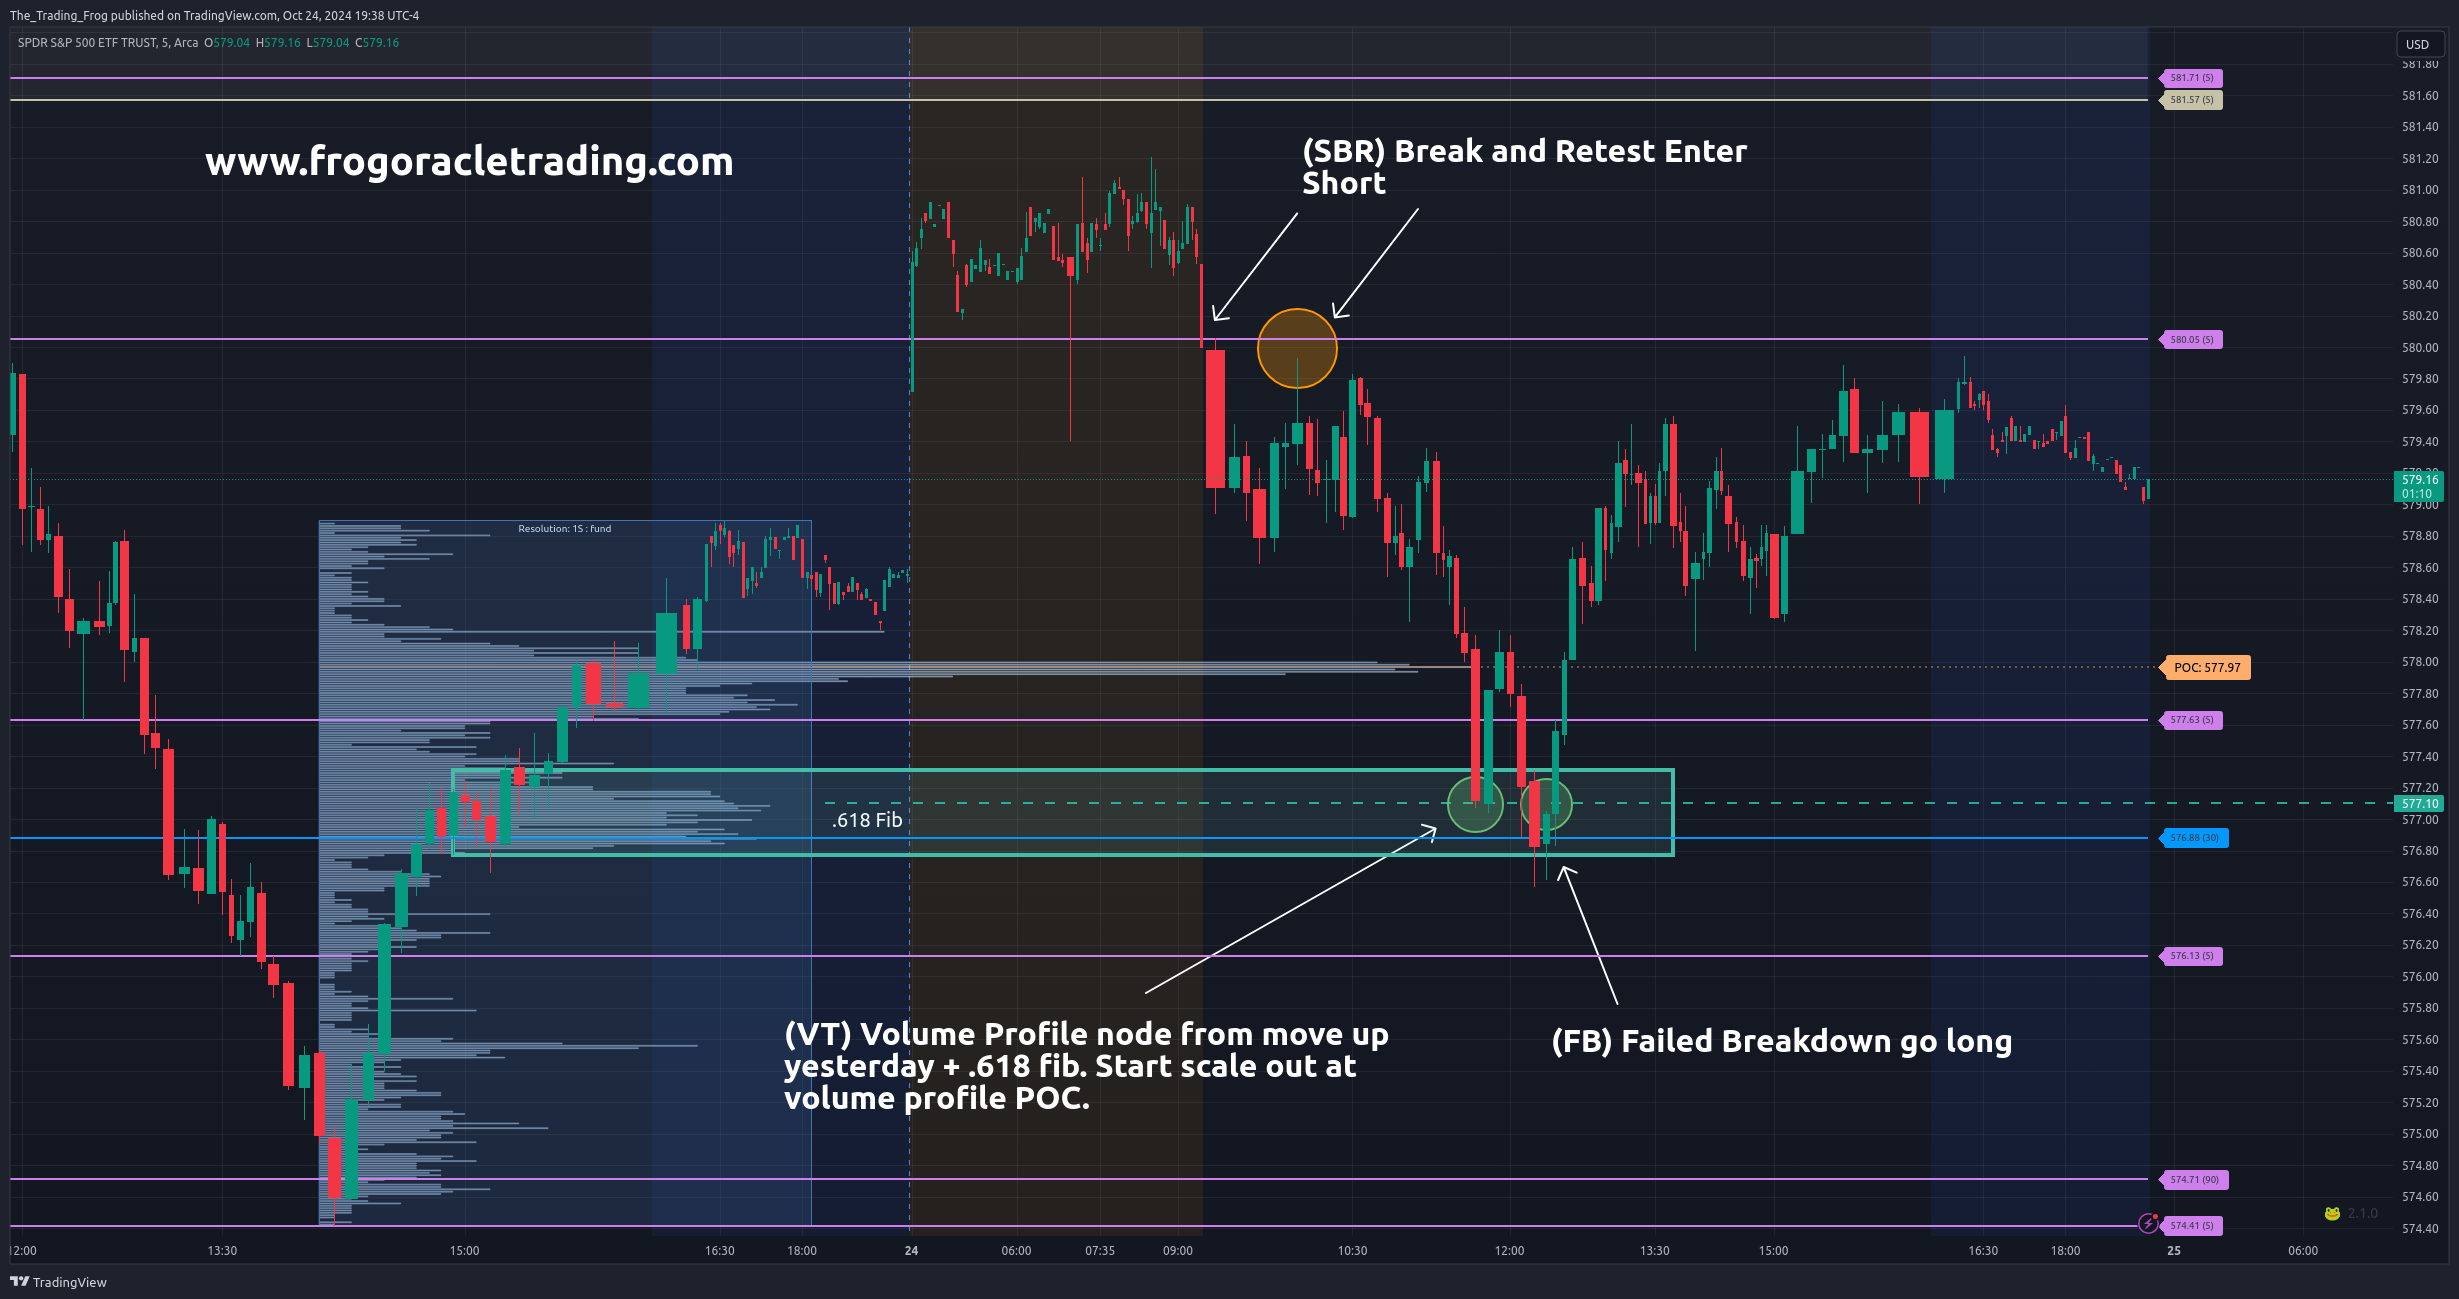
SPY - 2024/10/24 Several Setups
There were 3 clear setups on SPY today. The first was a SBR in the morning to go short. The second was the bounce from the bottom of the volume profile node + .618 fib. The third was the failed breakdown which resulted in a large rally.
SOL.USD - 2024/10/24 Several Setups
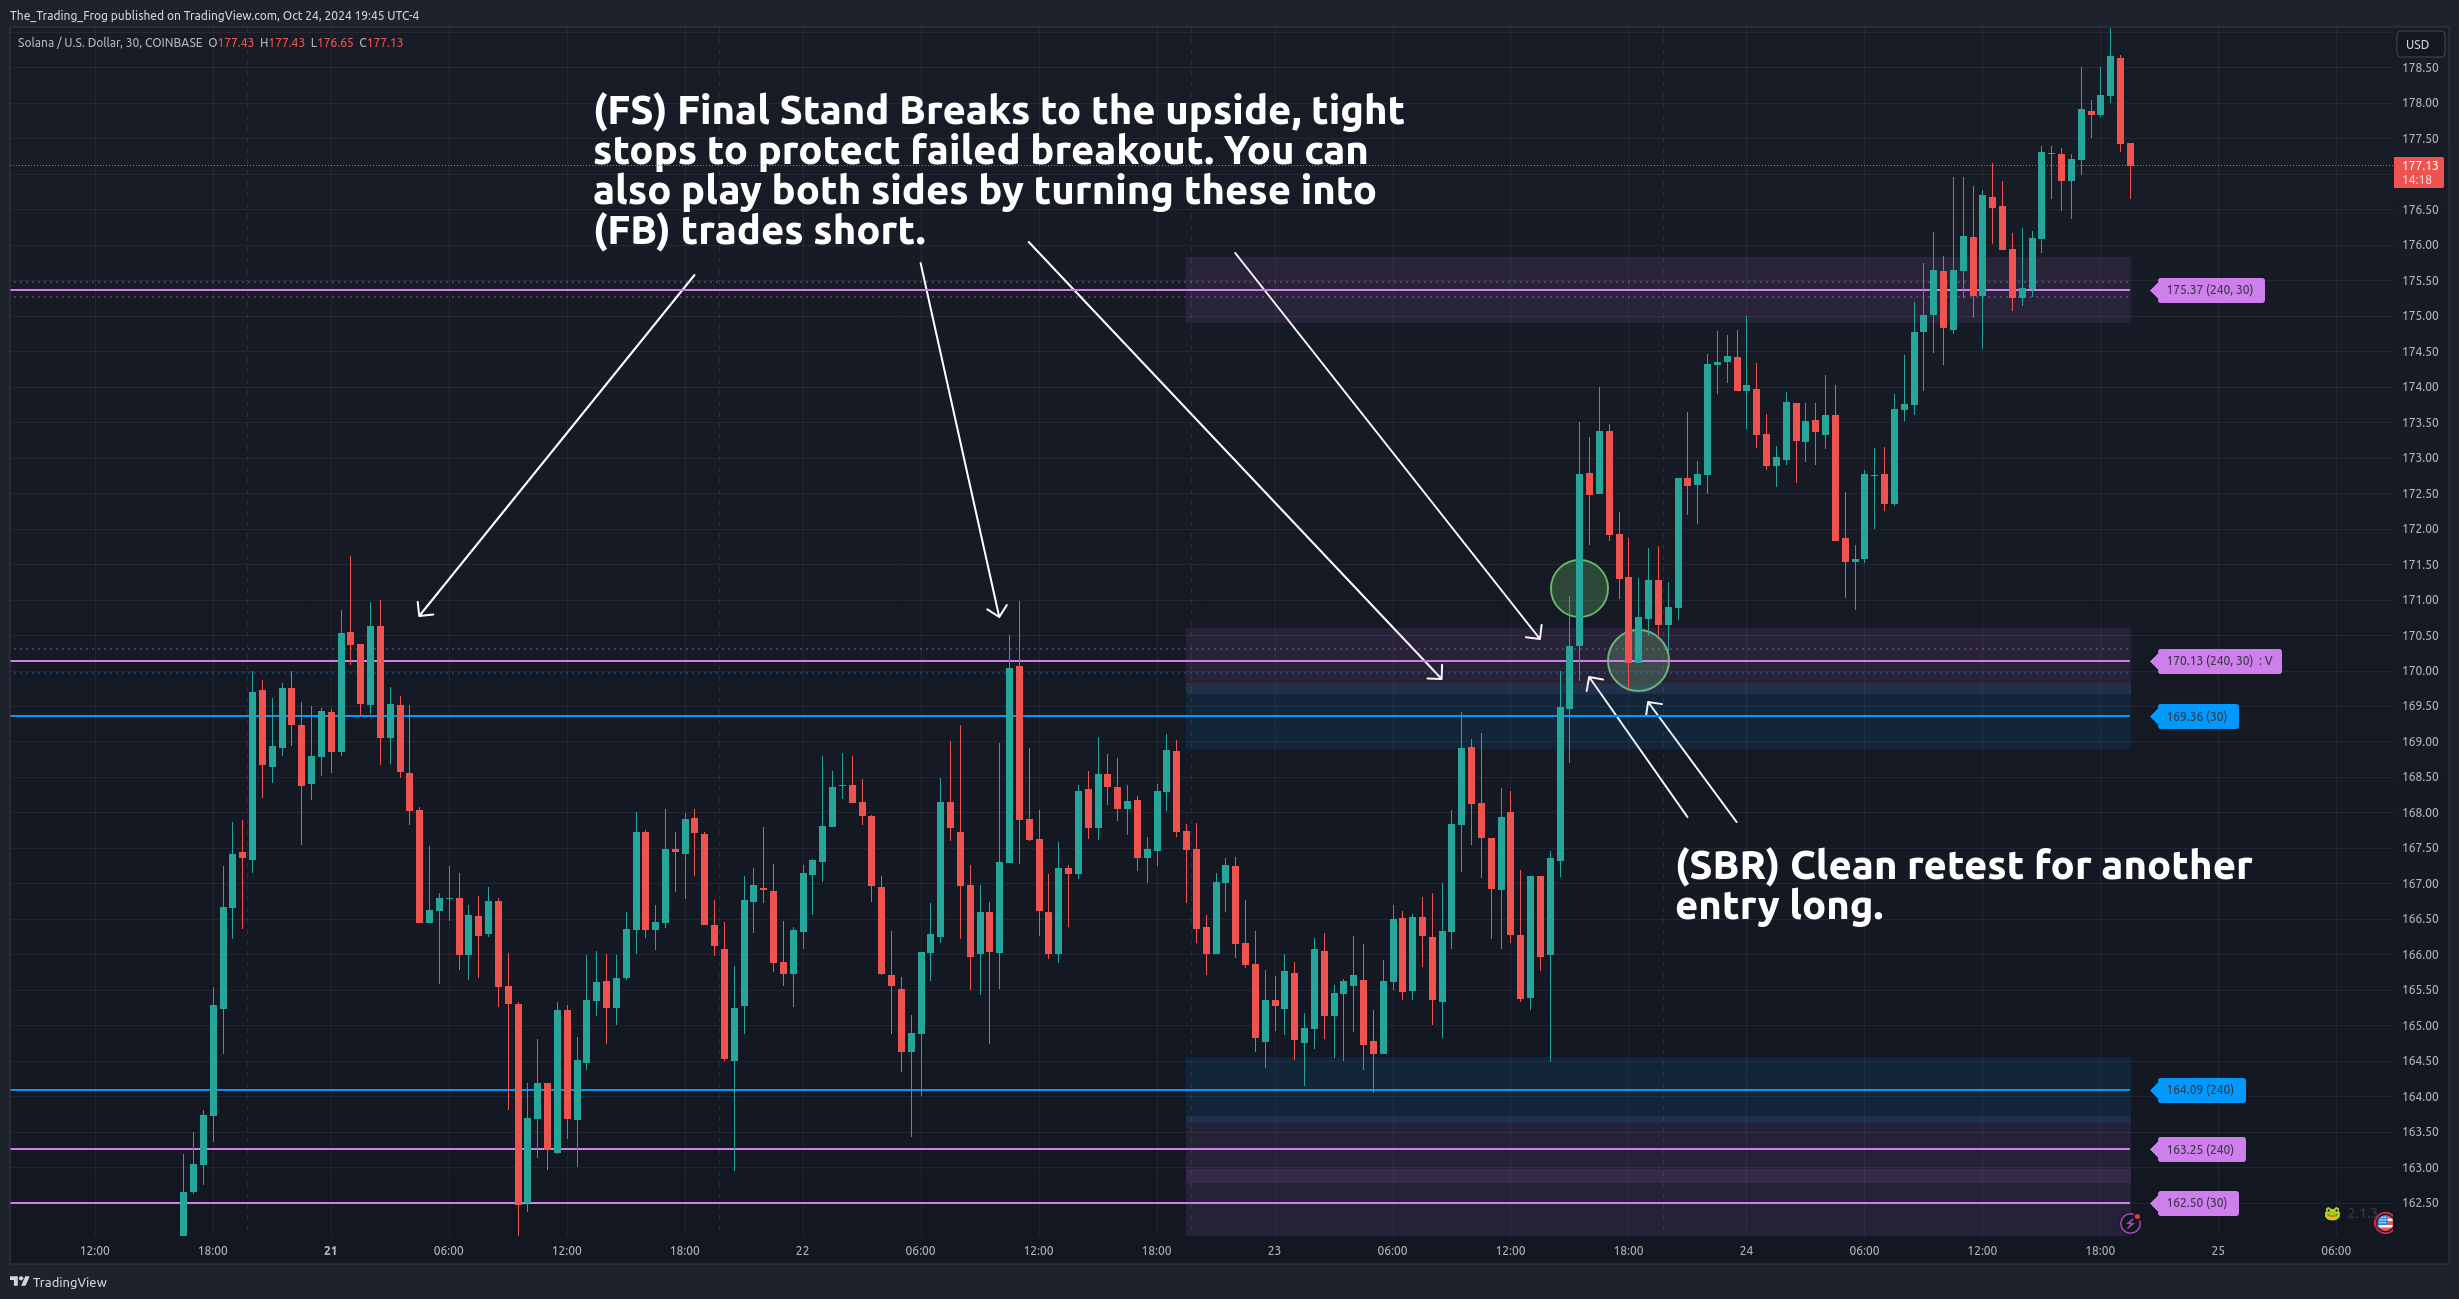
Here are a few examples of Failed Breakouts, that turn into a Final Stand. Followed by a very clean Support becomes Resistance play.
