S/R Strategies
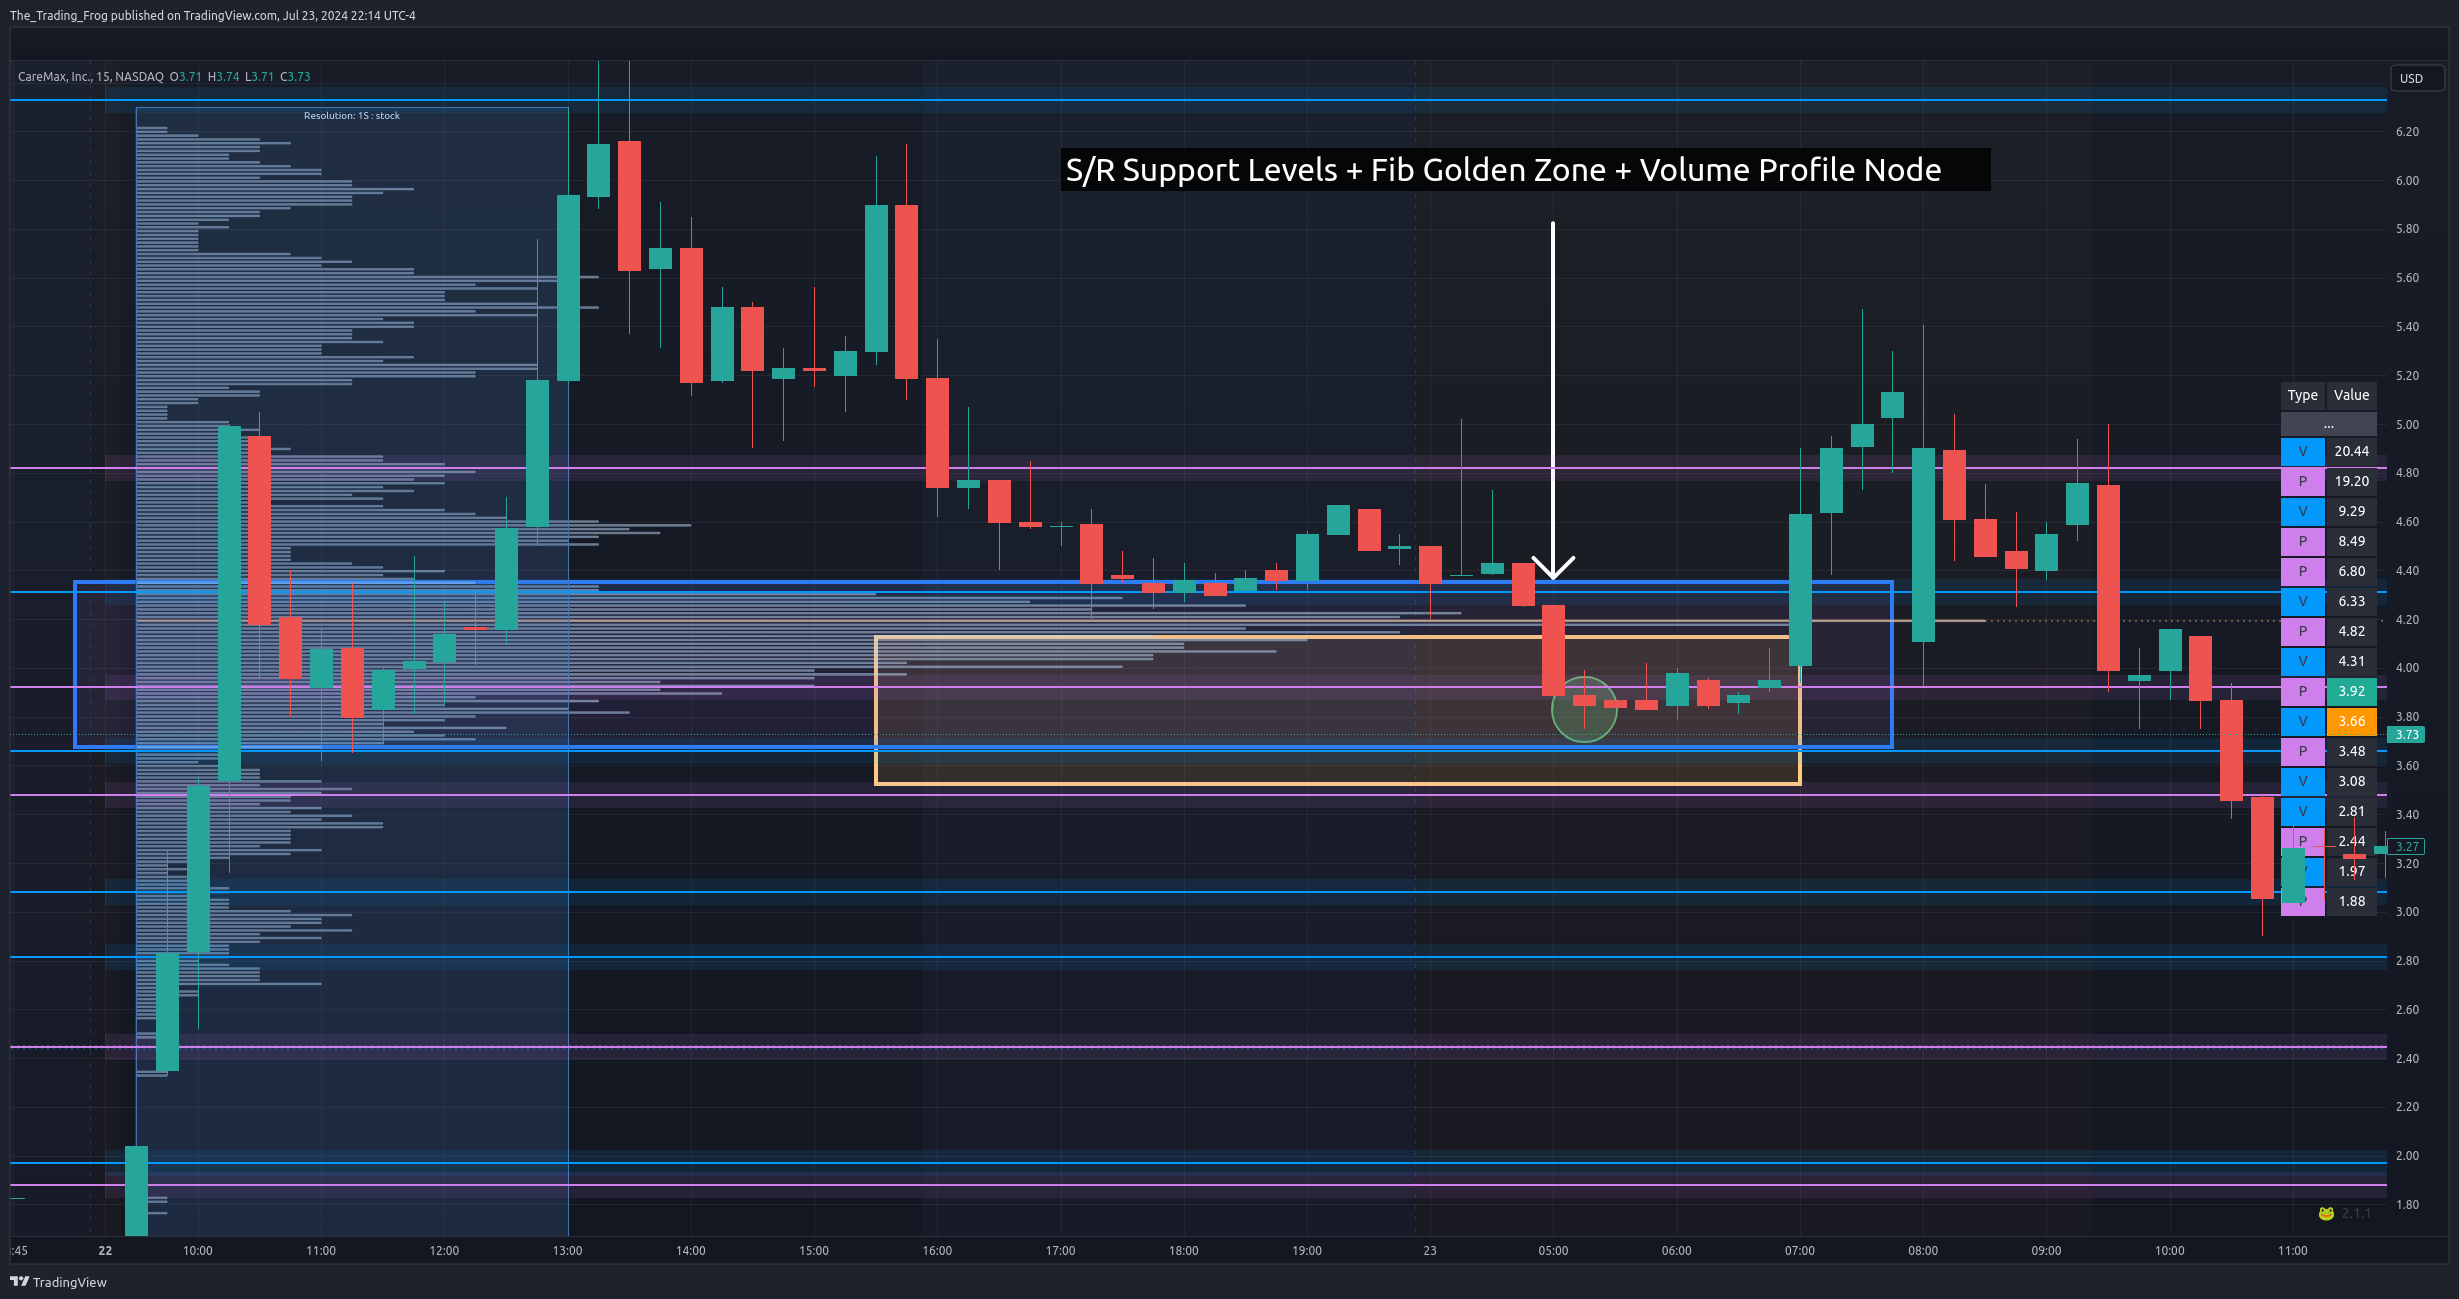
For all strategies, finding multiple confluences is a great way to increase the chances of a successful trade. I will often layer Fibonacci and Volume Profile levels over the S/R levels. Look for places where the different approaches point to the same price range and trade these areas of high confluence more confidently and with greater size.
Here the bounce happened at an S/R level, in the fib golden zone ( .5 to .618 ) and at the bottom of a volume profile node.
Support Becomes Resistance (SBR)
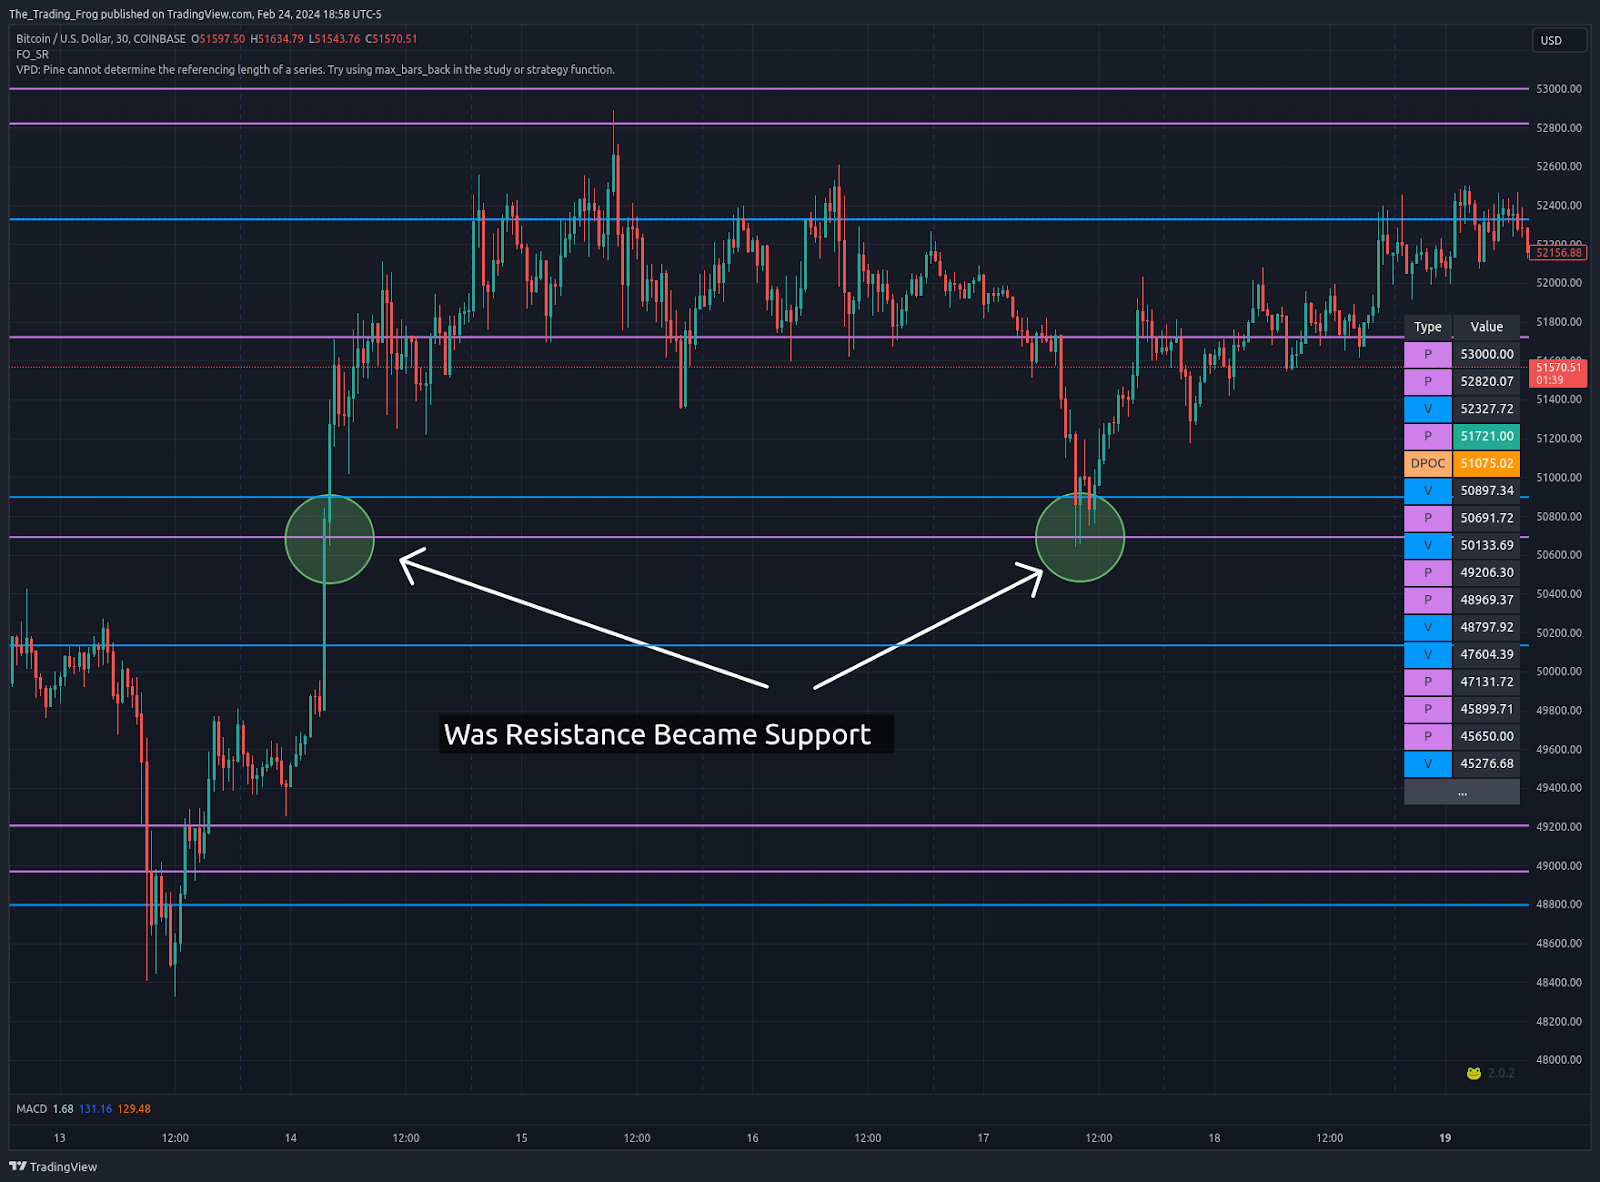
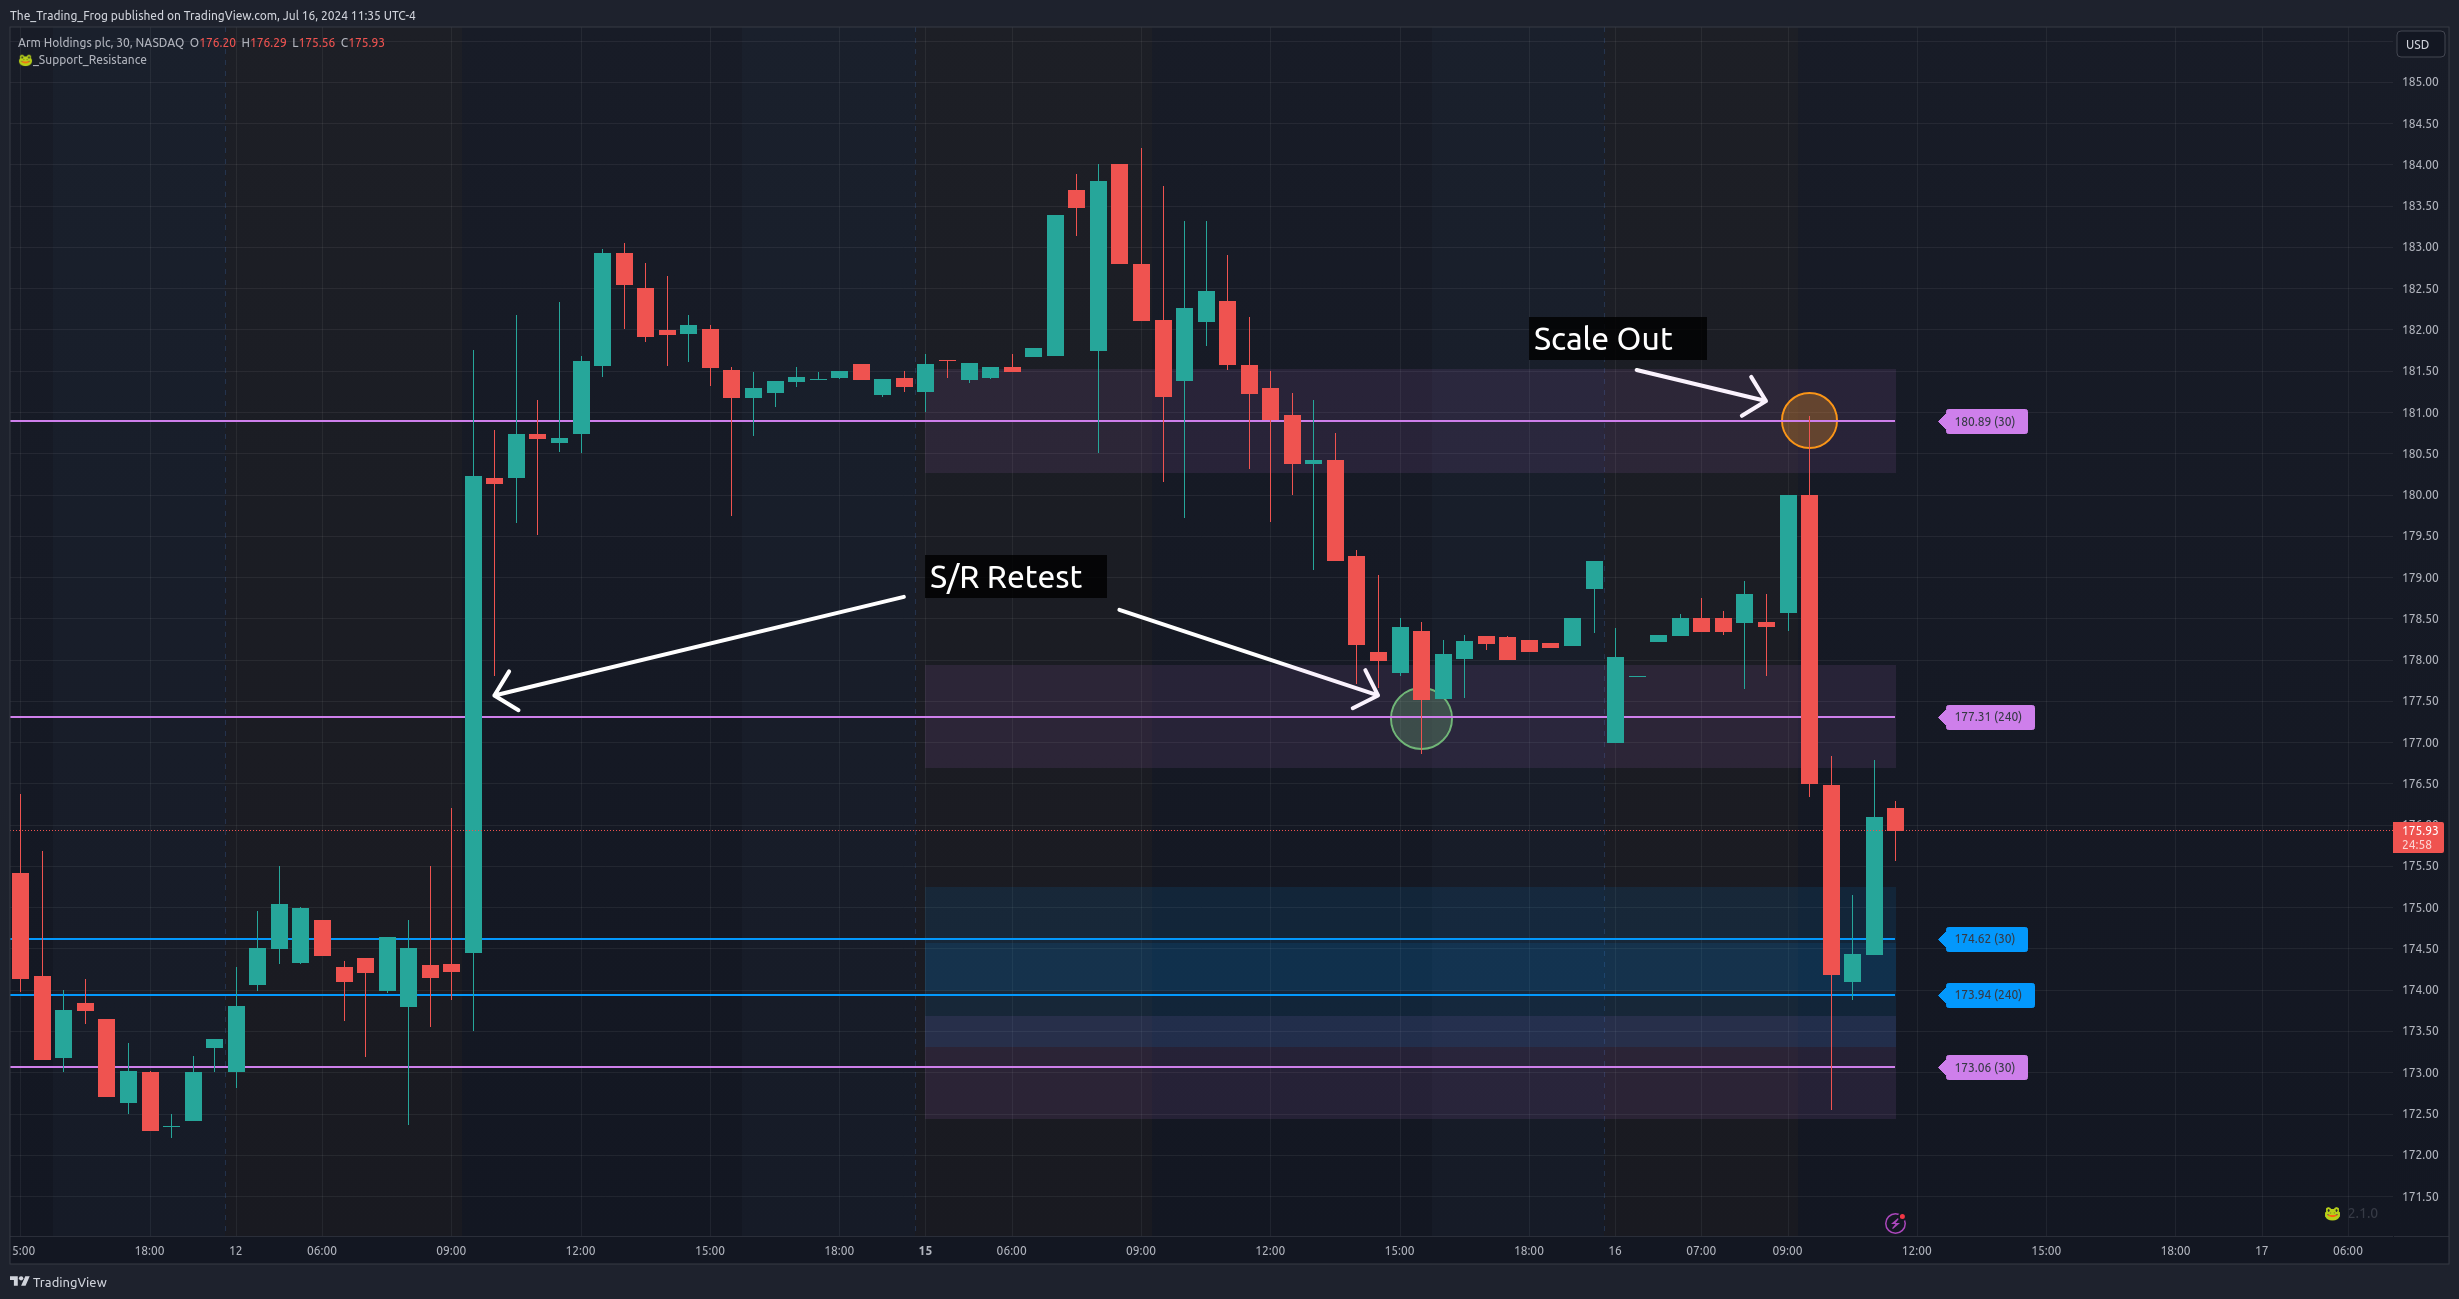
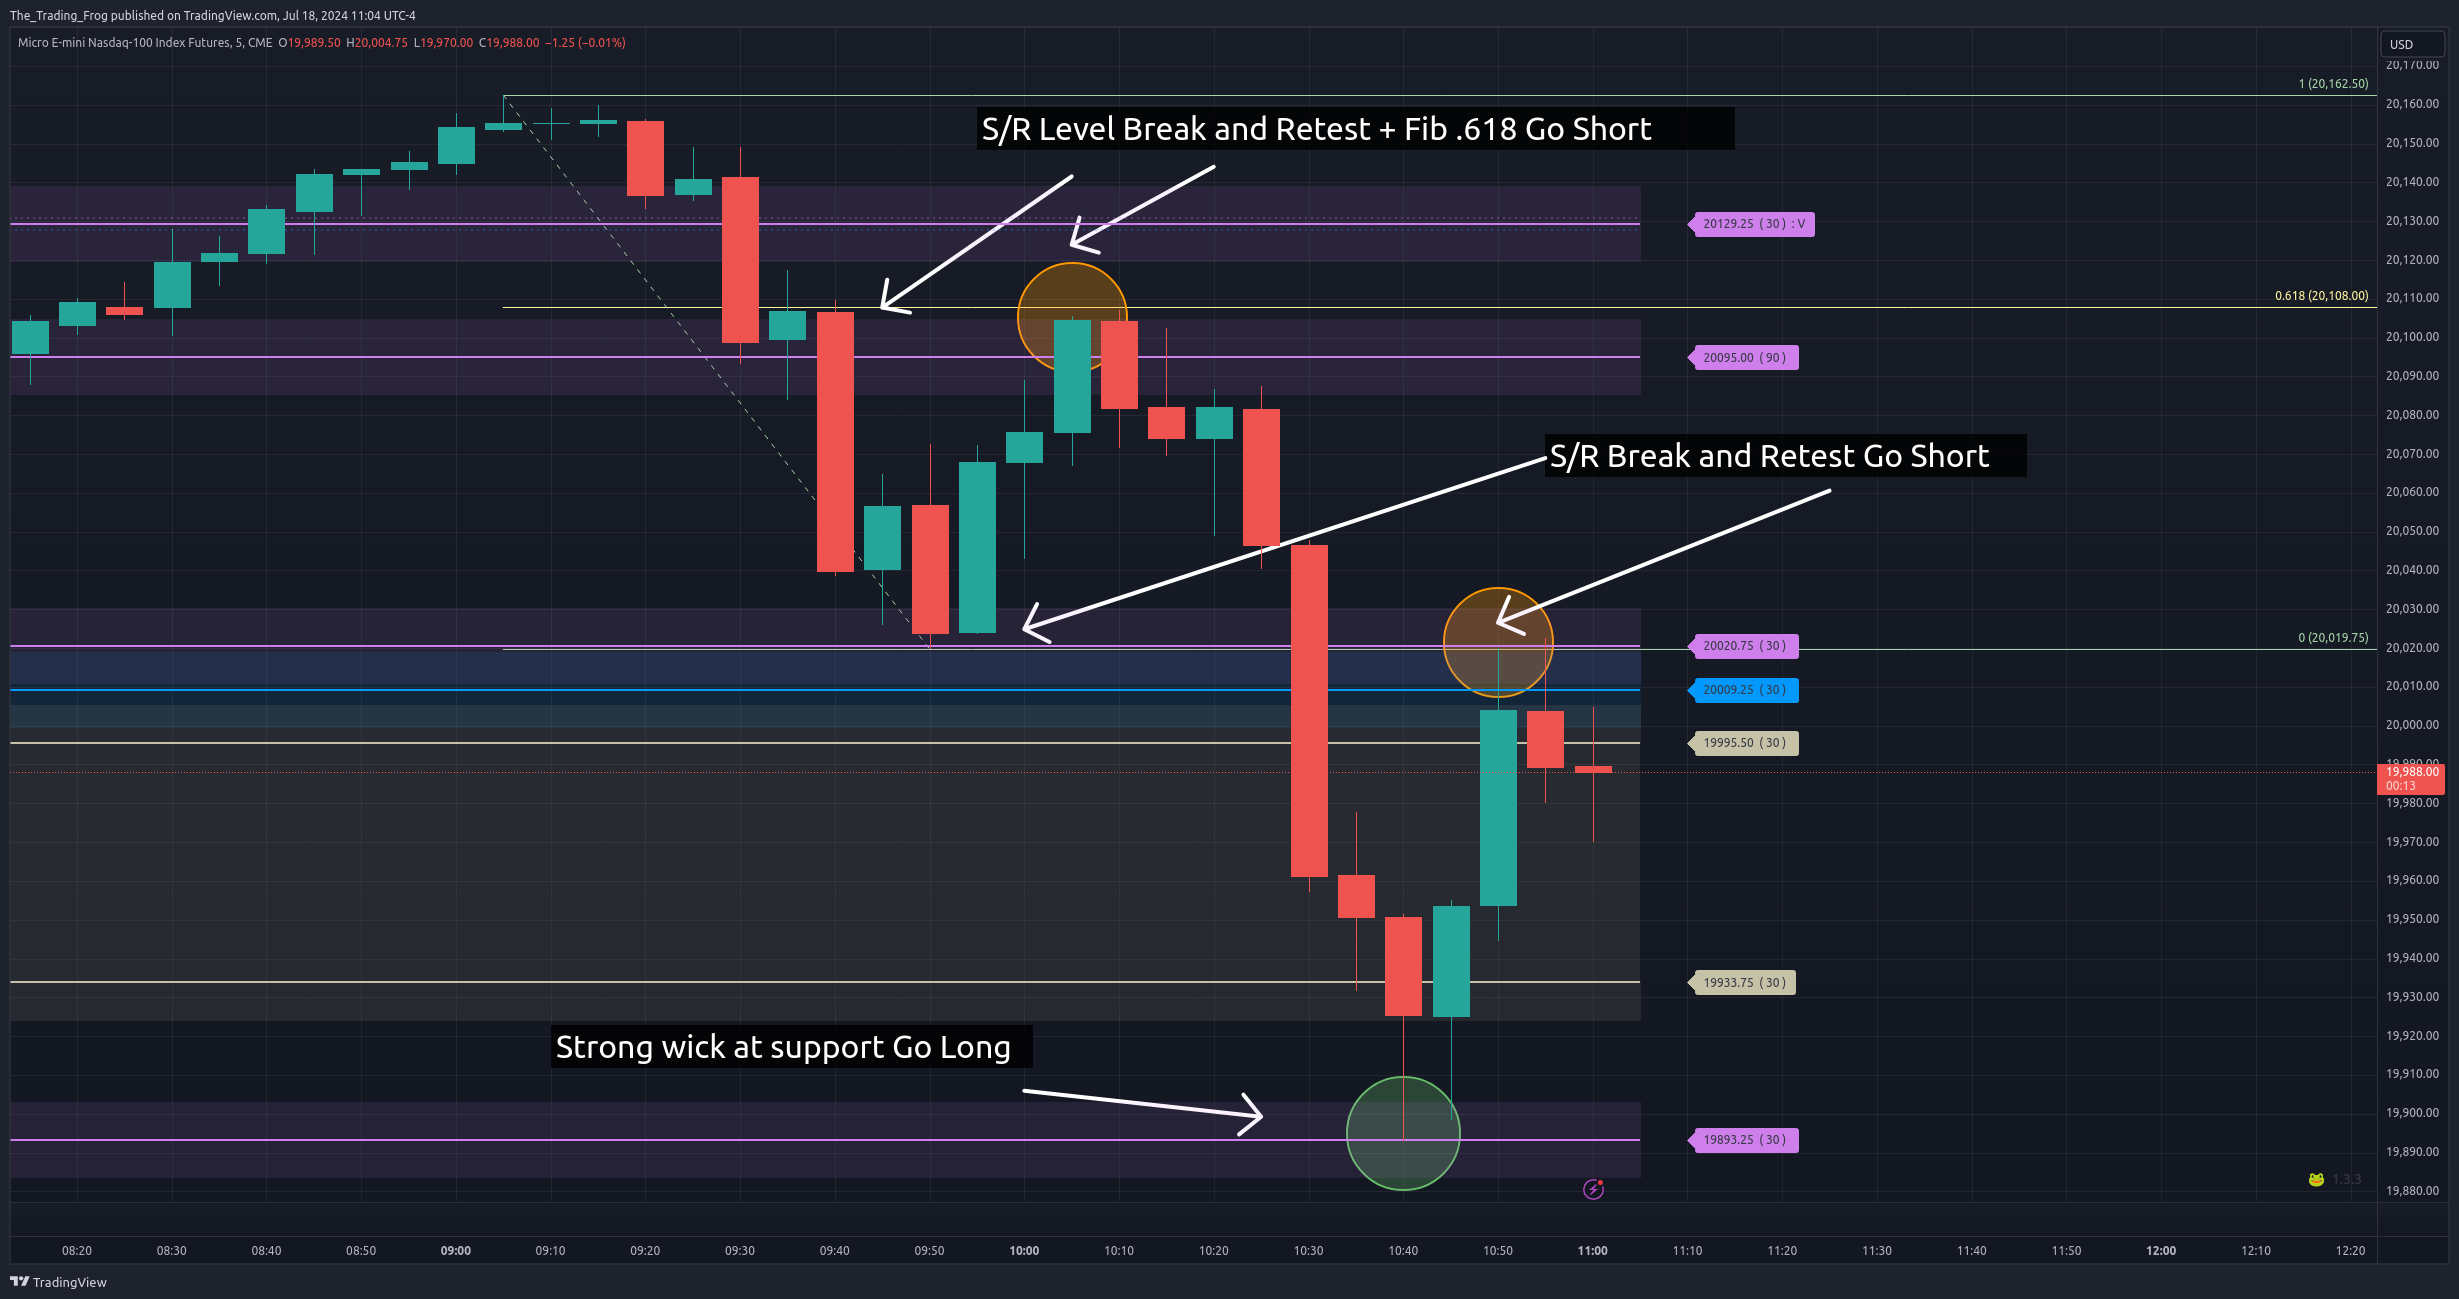
This is one of the most successful strategies leveraging the indicator levels and works in both the Long and Short directions. The typical trade involves identifying a critical level (where consolidation has happened at that level before breaking or the level has been tested several times historically).
The Setup
-
Identify Critical Levels
Look for levels where the price has consolidated before making a clear move (either up or down). Consolidation areas indicate indecision, and a subsequent break shows direction. Find levels that have been tested multiple times historically. This could be former support, resistance, or key pivot points. These levels are significant because they are often points where traders make decisions, and the market reacts accordingly.
-
Confirm Strong Reactions
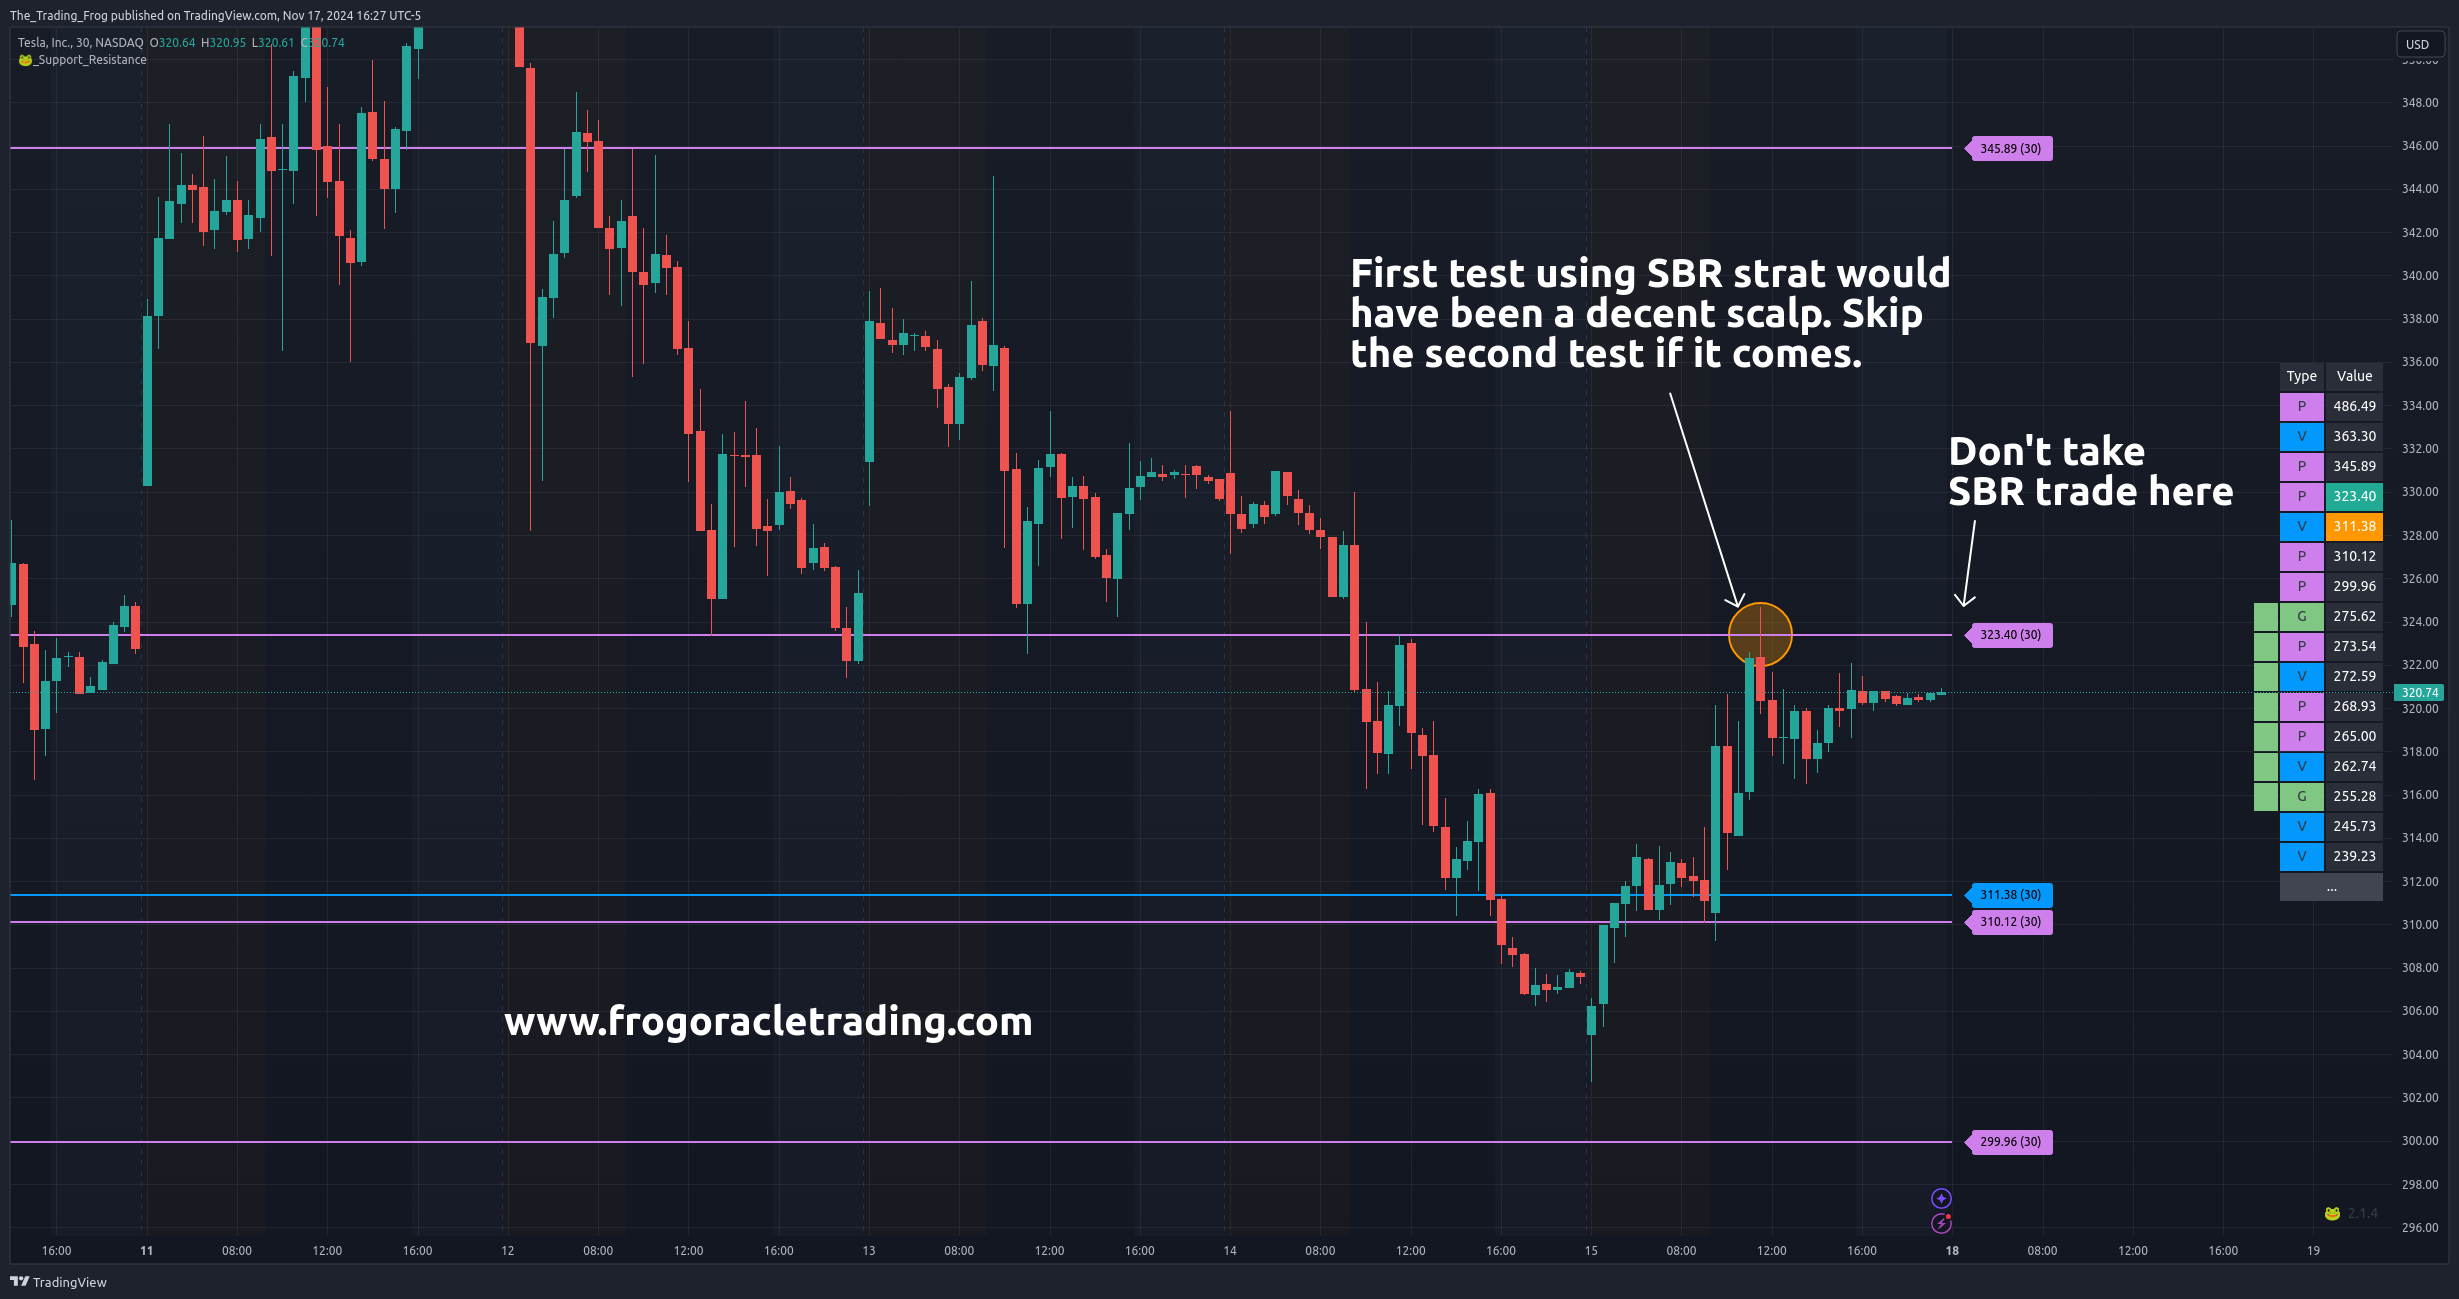
Focus on levels where there have been strong price reactions in the past. Look for areas with large wicks, indicating that the price quickly rejected the level. The more historical reactions you see at this level, the higher the likelihood it will be defended or retested. Make sure to note both the exact level and the surrounding area, as markets can often overshoot or slightly undershoot precise levels. This is where using the "Show Boxes Around Levels" option in the indicator can help. Keep in mind that once a level has been tested once and rejected if price moves back up to test again it is more likely to break through. Therefore normally it is best to only take a SBR trade on the first retest.
Example of skipping second attempt at SBR
-
Wait for a Level Breach
Monitor the critical level you have identified and wait for a clear breach. The breach should be decisive, often characterized by a large candlestick with a strong close beyond the level or an increase in volume.
-
Watch for a Retest of the Level
After the level is breached, wait for the price to pull back and retest the broken level. This is where traders look to confirm that the old support has become new resistance (or vice versa). Observe the retest closely, and look for a sign that the level is holding: a reversal candlestick pattern (e.g., doji, hammer, or engulfing candle) and/or decreasing volume on the pullback, followed by a surge of volume in the initial direction. The better the reaction off the retested level, the stronger the setup.
-
Enter the Trade in the Direction of the Initial Break
Once you have confirmation that the retest is holding, enter in the direction of the initial break:
For a Long Trade: Enter on a bounce back up after a higher level has been broken and retested.
For a Short Trade: Enter on a drop back down after a lower level has been breached and retested. You can use a market order for quicker execution or a limit order if you want a specific entry price near the retest.
-
Set Your Stop Loss
Place a stop loss just beyond the critical level that was breached and retested. For a long position, set the stop slightly below the retested support level. For a short position, set the stop slightly above the retested resistance level. Consider the volatility of the asset and use ATR (Average True Range) to determine a safe distance for your stop.
-
Target a Reasonable Profit Level
Scale out as the play progresses, use the other indicator levels as targets.
Notes
Look for strong historical reactions off the level. Bigger wicks in the past indicate significant rejection, which adds credibility to the level. The more historical tests and rejections you can identify, the stronger the likelihood of a successful retest. This strategy works across multiple timeframes but tends to perform well on 5-minute and 30-minute charts for intraday trading. Adjust your stop loss and profit targets based on the timeframe you are trading.
GAP Rejection (GR)
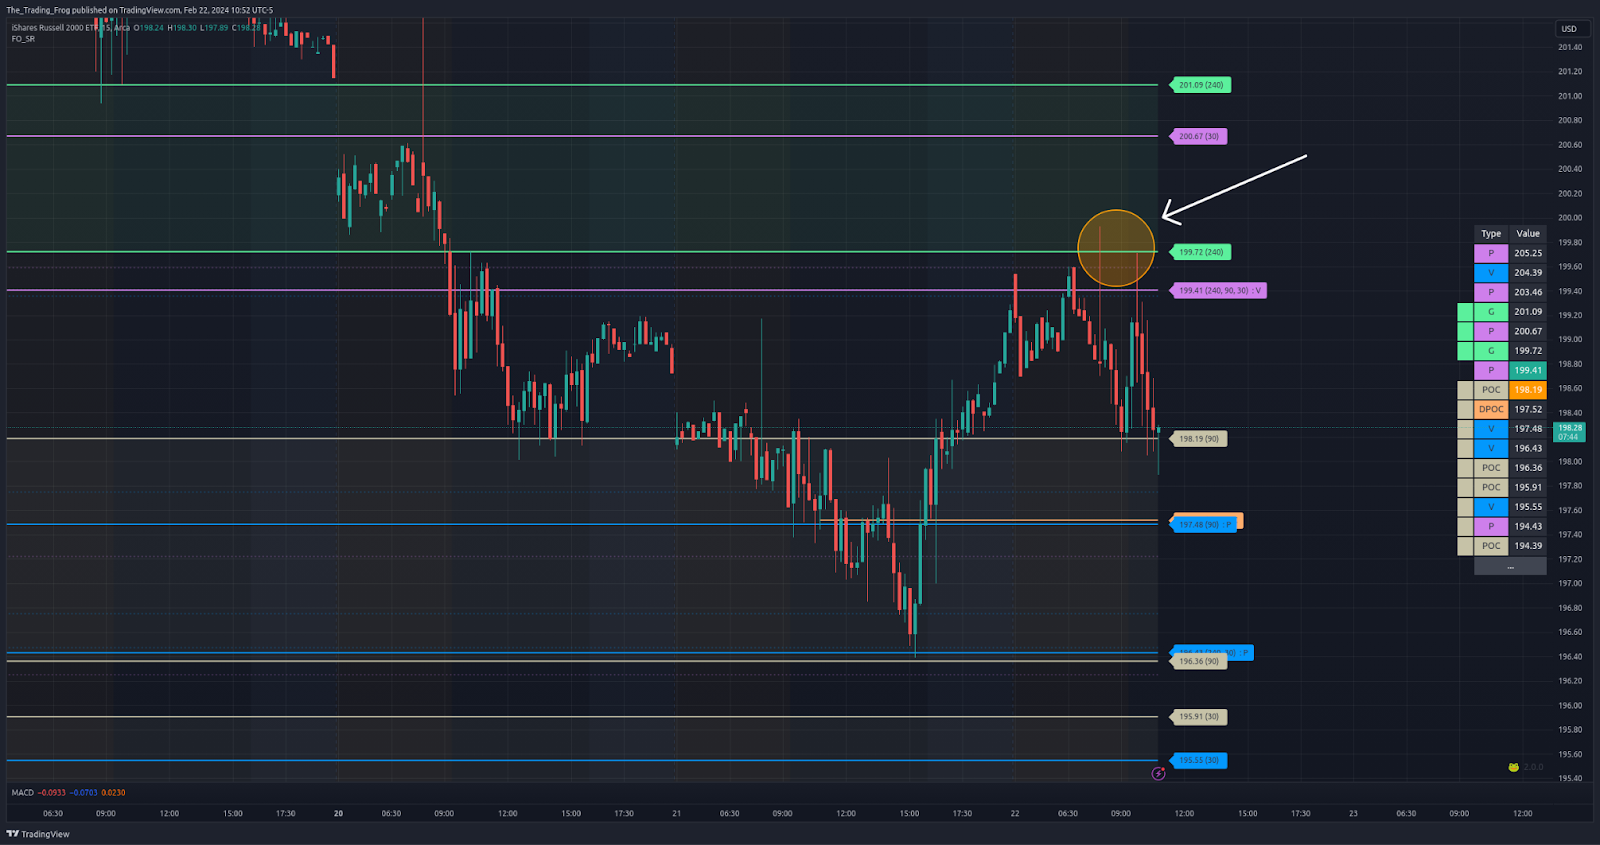
These trades can be seen quite often where the price will approach a GAP, possibly dip inside, and then move quickly in the opposite direction.
The Setup
-
Identify a GAP Near the Current Price Action
Look for a price GAP (area where no trading occurred) in recent price history using the S/R indicator. A GAP could be the result of an overnight move, earnings announcement, or any significant news. Note the GAP's location and its distance from the current price action.
-
Wait for Price Action to Approach the GAP
Monitor the price as it moves towards the GAP. Pay attention to momentum and whether the price is slowing down or showing signs of hesitation as it nears the GAP.
-
Start Scaling In Above the GAP
Begin to scale into your position just above the GAP. This means you can enter in small increments as the price moves closer to the GAP. Scaling in gradually helps mitigate risk and allows for a better average entry price. Look for signals like wicks or candles showing rejection, indicating potential reversal points.
-
Allow Some Room for Price to Dip Into the GAP
Be prepared for the price to dip slightly into the GAP. Gaps are known to act as potential resistance or support, but some price penetration is normal. Don't panic if the price moves into the GAP; instead, ensure your trade plan accounts for this slight dip.
-
Set a Stop Loss tightly below your last entry which should be inside the GAP.
-
Manage the Trade as Price Moves Away from the GAP
If the price reverses direction before fully filling the GAP, the trade is in your favor. Monitor the momentum and look for signs of continued reversal. Adjust your stop loss to breakeven once the trade moves significantly in your direction to protect your capital. Consider scaling out of your position if the reversal is strong or if the price reaches the next resistance/support level.
Notes
Gaps often act as resistance or support levels before they are fully filled. Use this behavior to your advantage, anticipating that price may hesitate or reverse as it nears the GAP. Be cautious of false breakouts. A strong break into the GAP with volume may indicate that the price is intent on filling the GAP fully, in which case you should exit quickly if your stop isn't already triggered.
GAP Close Reversal (GCR)
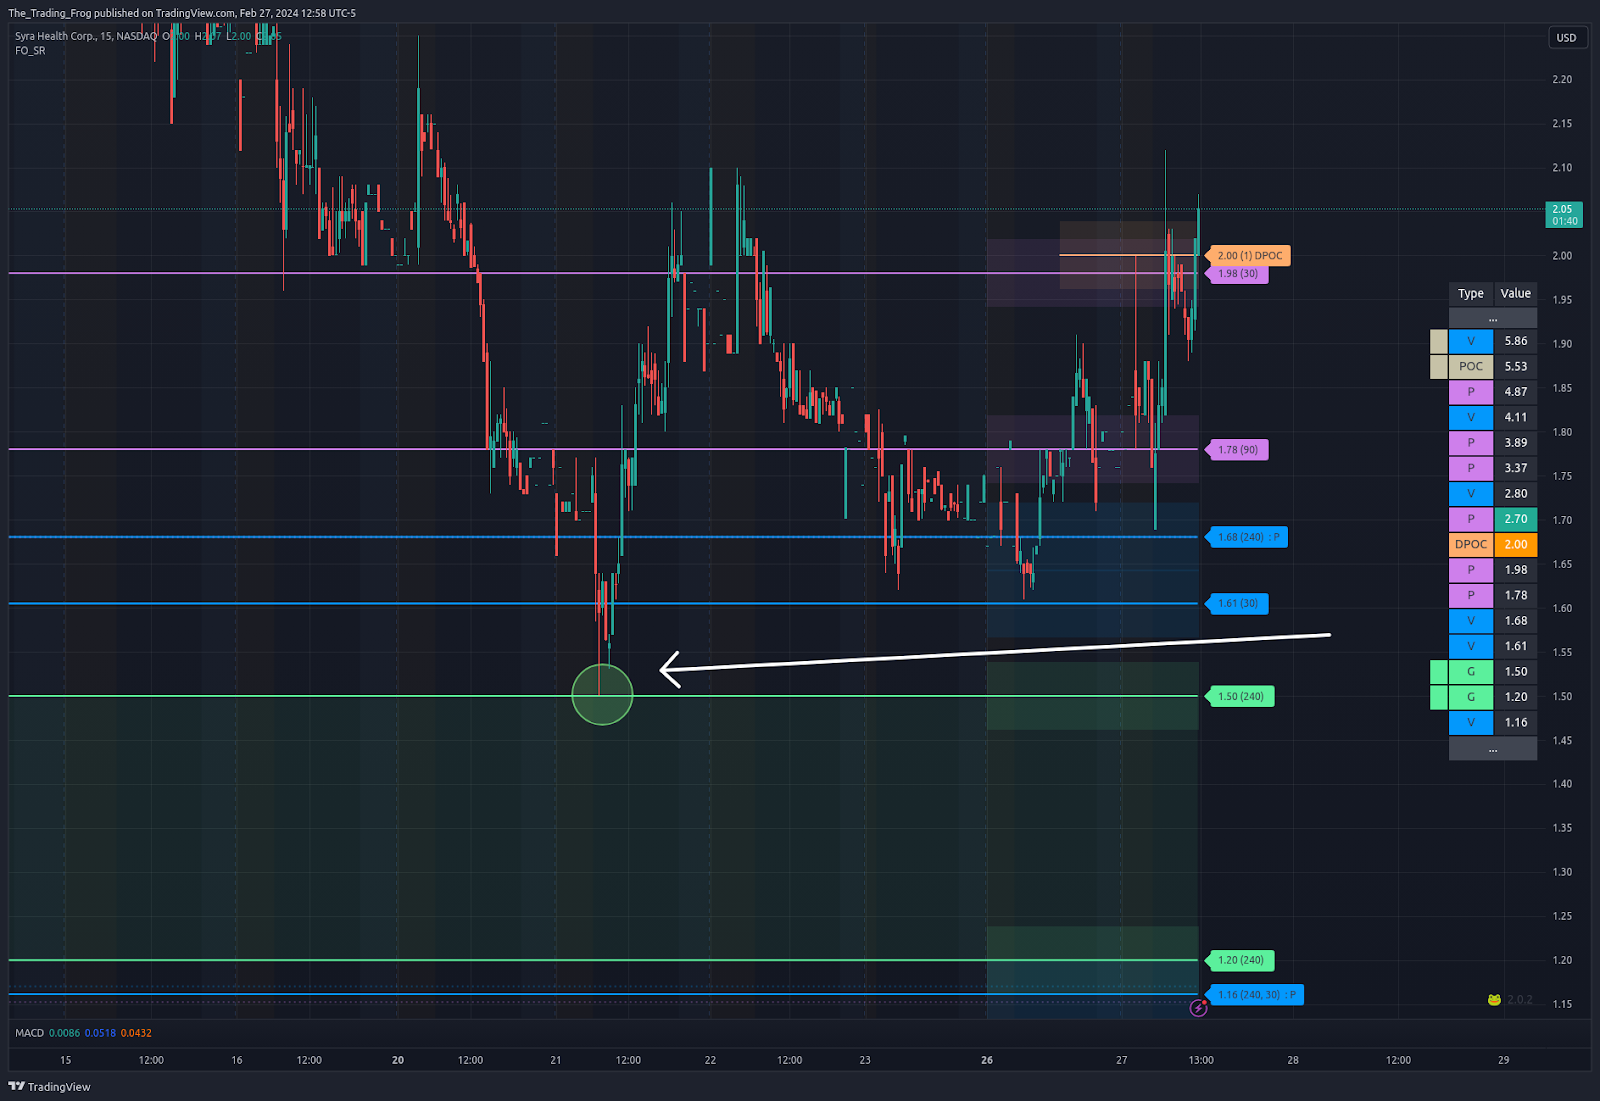
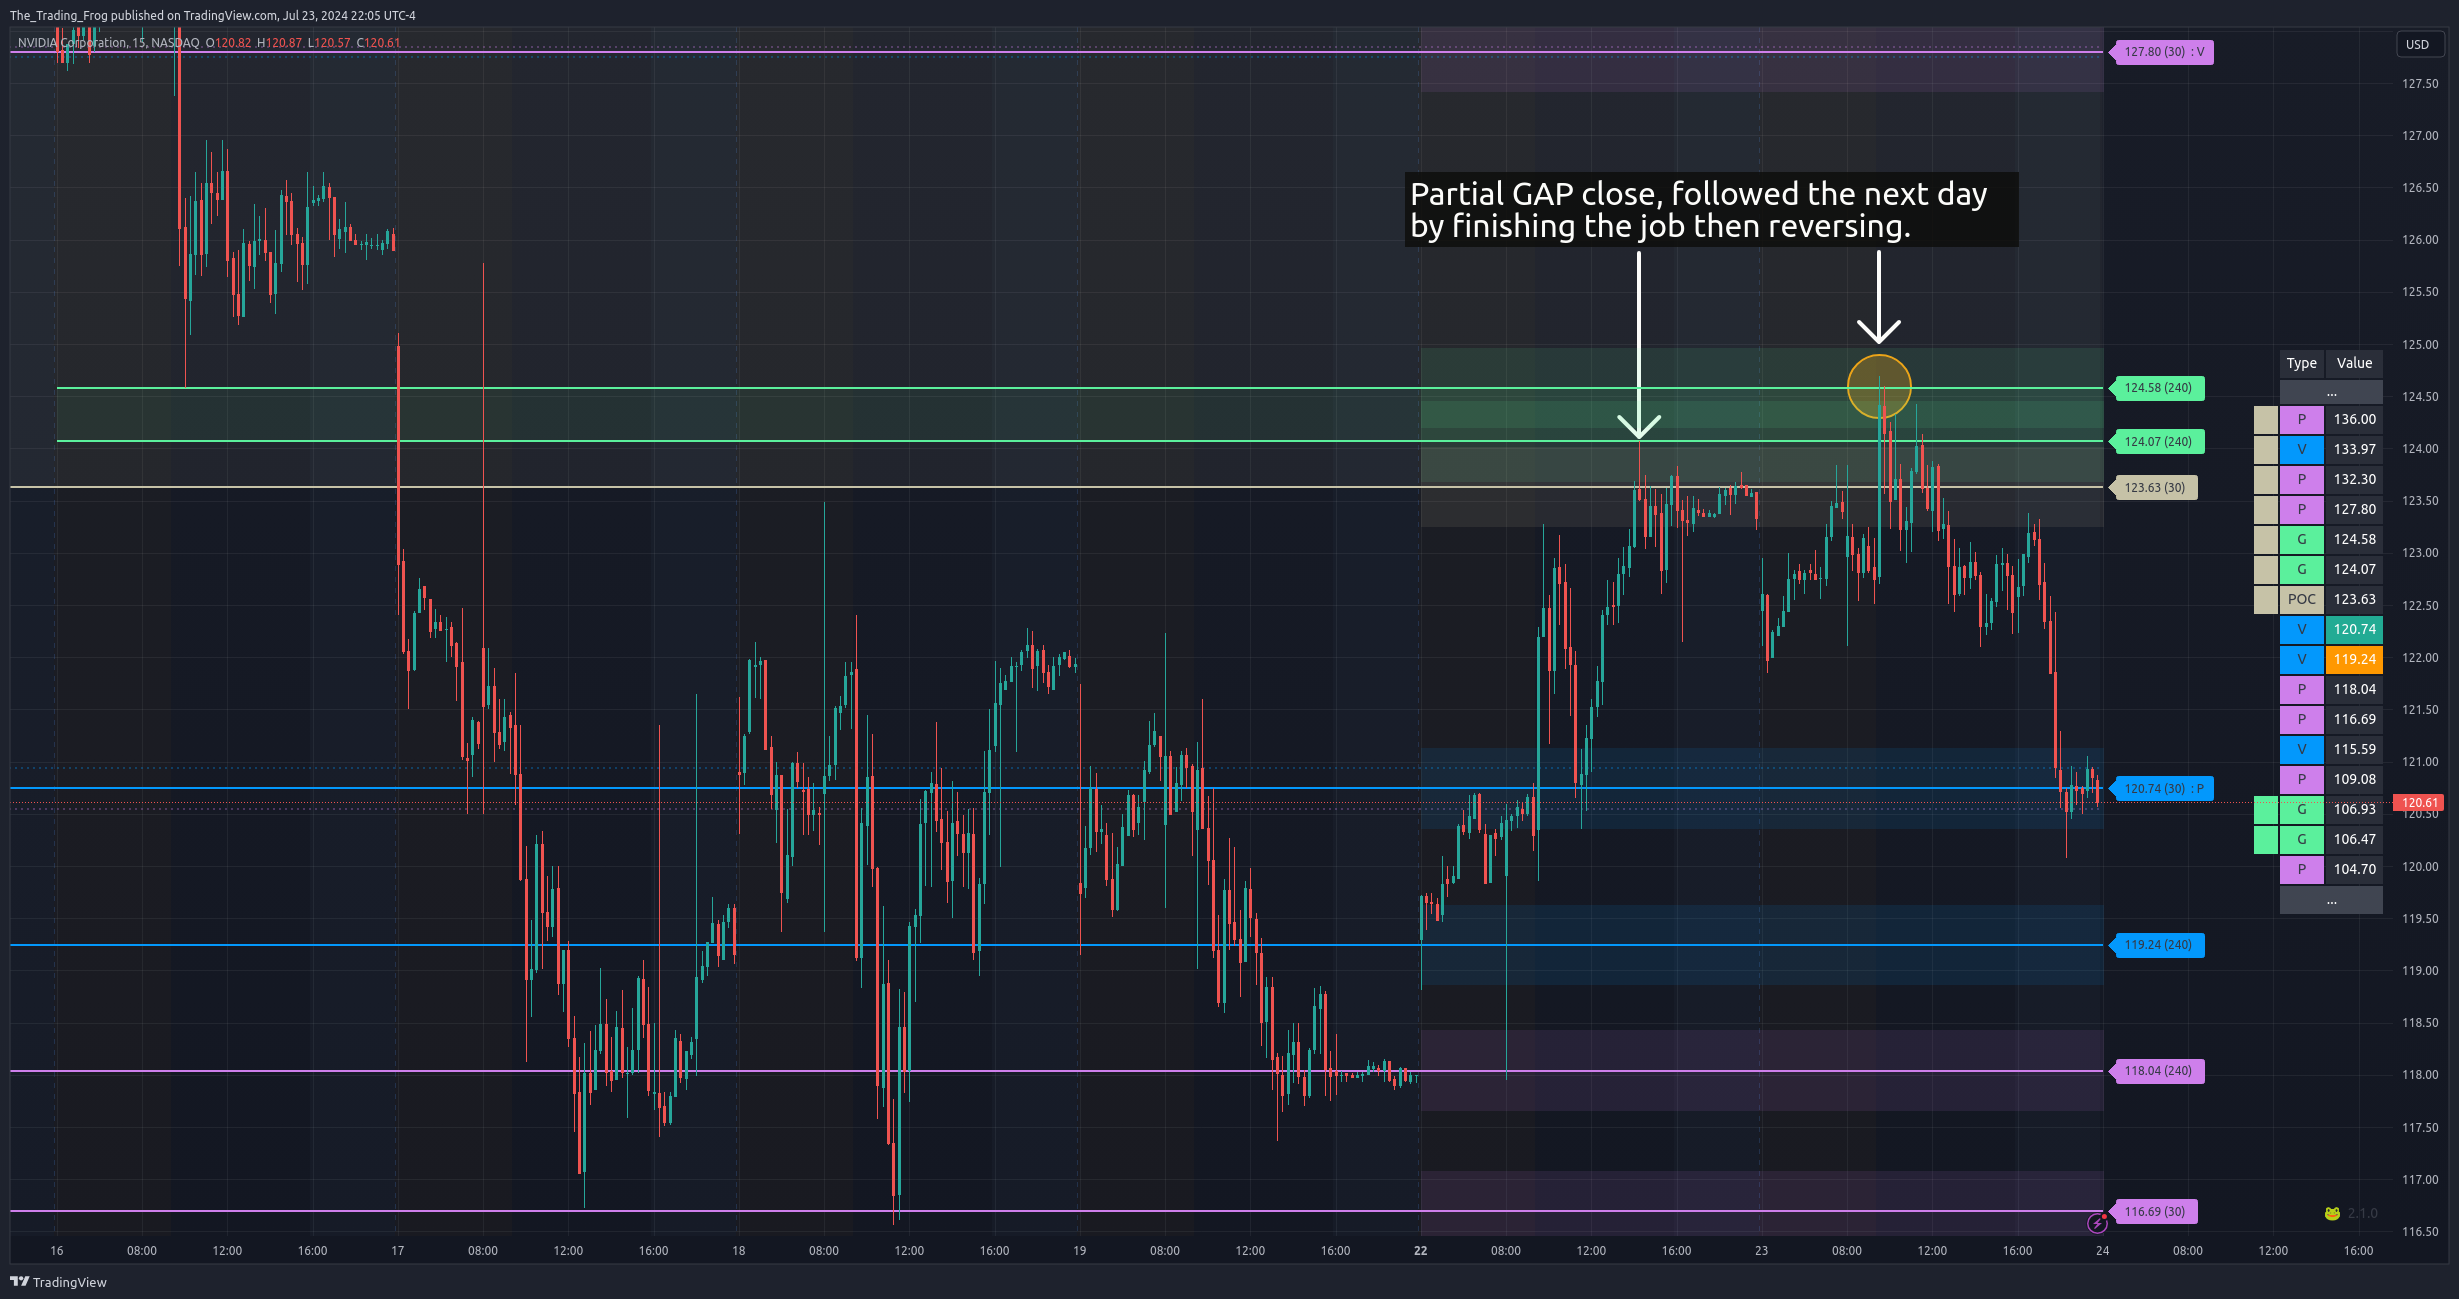
Often there will be a strong push once a GAP is entered to finish filling it. Once the GAP is filled some of this pressure is released and at least a temporary bounce can occur.
The Setup
-
Identify a GAP Near the Current Price Action. See above strategy for more details.
-
Wait for the Price to Nearly Close the GAP
Monitor the price action as it moves towards closing the GAP. Pay attention to the price behavior: signs of exhaustion, slowing momentum, or decreased volume can indicate that the pressure is weakening.
-
Begin Scaling In as the GAP is Nearly Closed
Start scaling into your position as the price nears the end of the GAP:
For a GAP Below: Scale in as the price nears the bottom of the GAP.
For a GAP Above: Scale in as the price nears the top of the GAP.
Use small increments to scale in, creating an average entry near the end of the GAP.
-
Allow Room for a Slight Overshoot of the GAP
It is common for the price to overshoot the end of the GAP slightly before reversing, due to residual momentum. Allow a little space for this overshoot, but be mindful of your risk. The stop loss should be set slightly below (for a long position) or above (for a short position) the end of the GAP to accommodate this possible move.
-
Scale Out on the Bounce
Once the GAP is filled and the price begins to bounce, start scaling out aggressively:
Take partial profits quickly as the bounce begins, as these trades are counter-trend and may not last long.
Leave a small position (runners) for the chance of a larger move, but expect the prevailing trend to potentially resume. Manage your stops by moving them to breakeven or above entry if the bounce shows significant strength.
Notes
This is a counter-trend trade, so it’s crucial to manage risk carefully and avoid overexposure. Scale out aggressively to lock in profits because the bounce may be short-lived before the main trend resumes. If the GAP takes several days to close, the bounce can often be stronger and have more follow-through. Keep in mind that quick and sharp GAP closes are less likely to produce a significant bounce, so adjust your position size and scaling strategy accordingly.
DPOC Bounces (DPOCB)
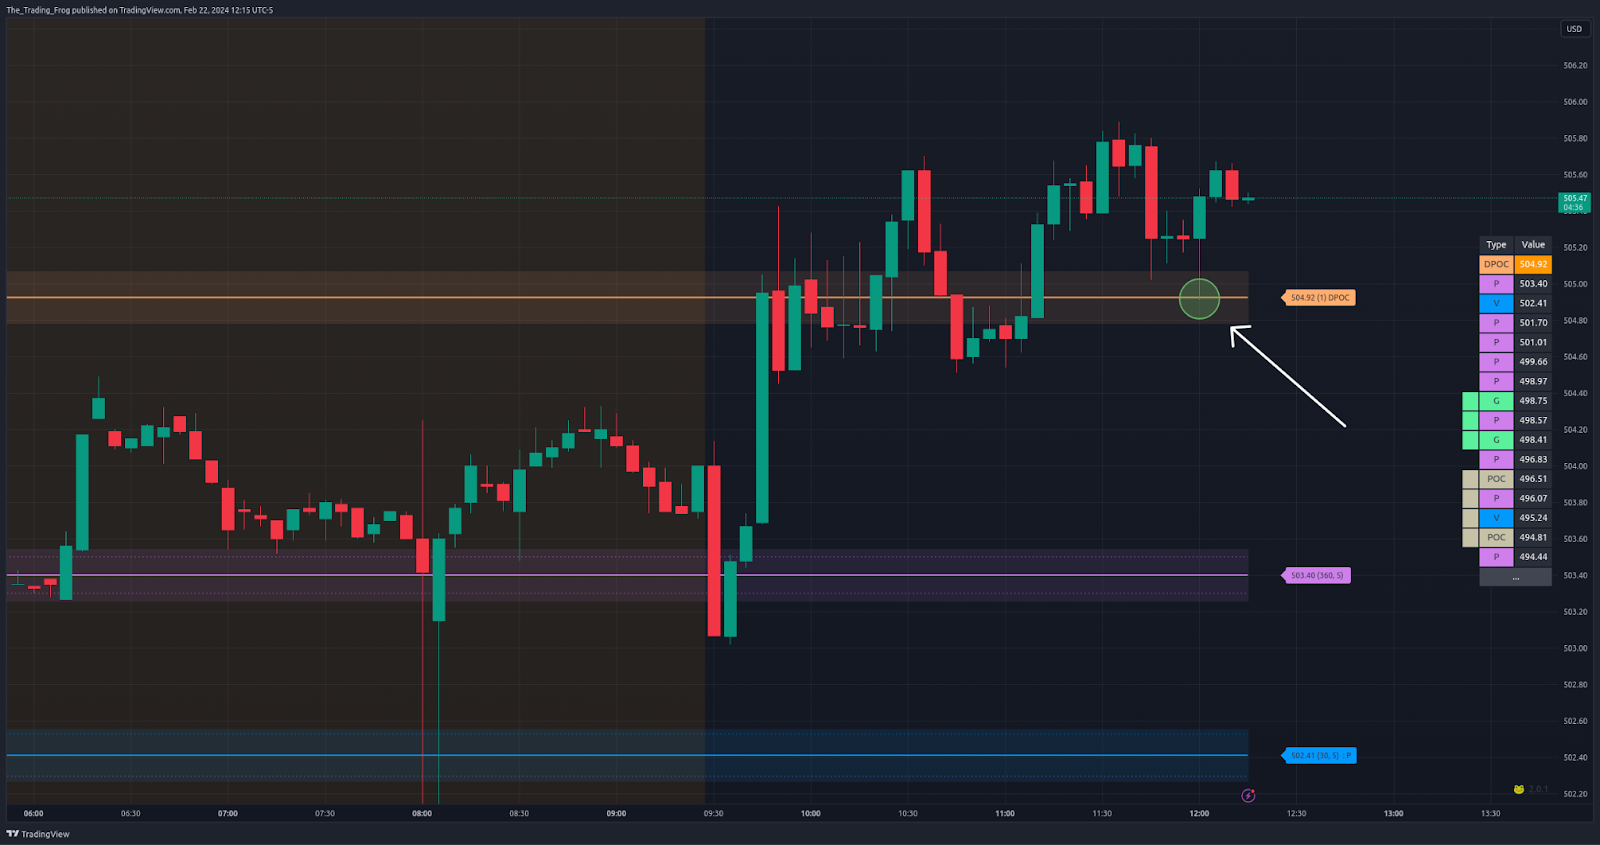
The DPOC represents the area most of the trading volume has occured in over the last 1-3 days (1 is default). These volume nodes will often act as a support/resistance level as previous buyers/sellers work to defend their positions.
The Setup
- Wait for price action to approach the DPOC and play for a scalp in the opposite direction of the trend.
- Can also be traded using a strategy wick SBR defined above.
Notes
- For DPOC trades, it is nice to have additional confluences to increase the probabilty of a succesful trade.
Final Stand (FS)
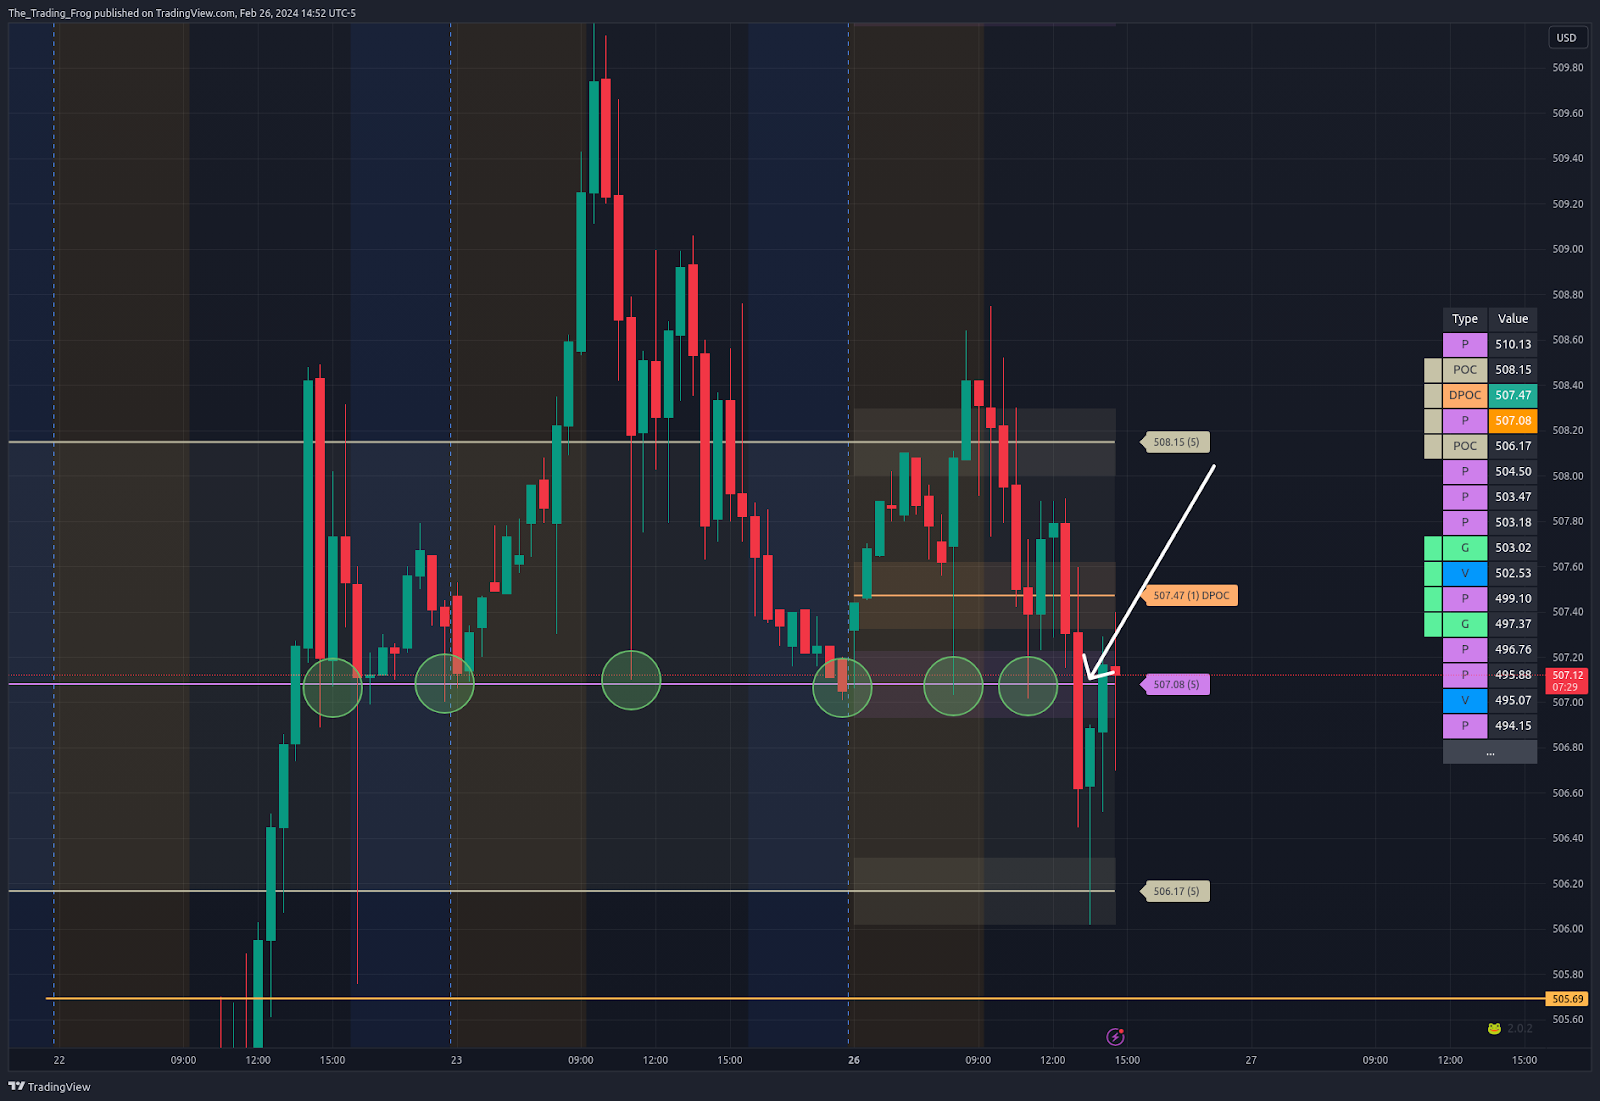
This setup involves a level which has been tested many times. If it finally breaks through you can take a trade in the direction of the break with a tight stop above the level.
The Setup
-
Identify a Critical Level with Multiple Tests
Look for a key support or resistance level that has been tested at least two times and has held each time. The more tests the level has endured without breaking, the stronger it is, and the more significant a breakout will be.
-
Monitor Price Action at the Critical Level
Pay attention to how price behaves as it approaches the critical level for the third time (or more). A decisive, strong move towards the level could indicate that a breakout is imminent. Use volume as a key indicator: increased volume as price approaches the level can signal potential strength in the move.
-
Enter the Trade on the Breakout
If the price breaks through the critical level, enter the trade in the direction of the breakout:
For a Break Above Resistance: Enter a long position as price breaks above the resistance.
For a Break Below Support: Enter a short position as price breaks below the support.
-
Place a Tight Stop-Loss Just Beyond the Broken Level
For a long trade (breaking above resistance), place your stop-loss slightly below the breakout level. For a short trade (breaking below support), place your stop-loss slightly above the breakout level. A tight stop is crucial for minimizing losses if the breakout fails and price reverses. If it does then you can switch to a FB trade described below.
-
Consider Waiting for a Retest for Additional Confirmation
An alternative strategy is to wait for the Support Becomes Resistance (SBR) or Resistance Becomes Support (RBS) play. After the initial breakout, wait for price to return and retest the broken level. If the level now acts as a new support or resistance, it confirms the breakout’s validity. Enter the trade if the retest holds and price resumes in the breakout direction. This strategy is more conservative and can reduce the risk of getting caught in a false breakout.
Notes
Confluence is Key: Look for additional confirmation from patterns, volume, or other indicators to increase the success rate of the setup.
Breakouts with Momentum: Prefer breakouts that happen with strong volume, as low-volume breakouts are more prone to failure.
Tight Stop Loss: Using a tight stop loss just beyond the breakout level protects you from false breakouts and minimizes losses.
Bounce And Pop (BAP)
The Setup
-
Identify the Key Level
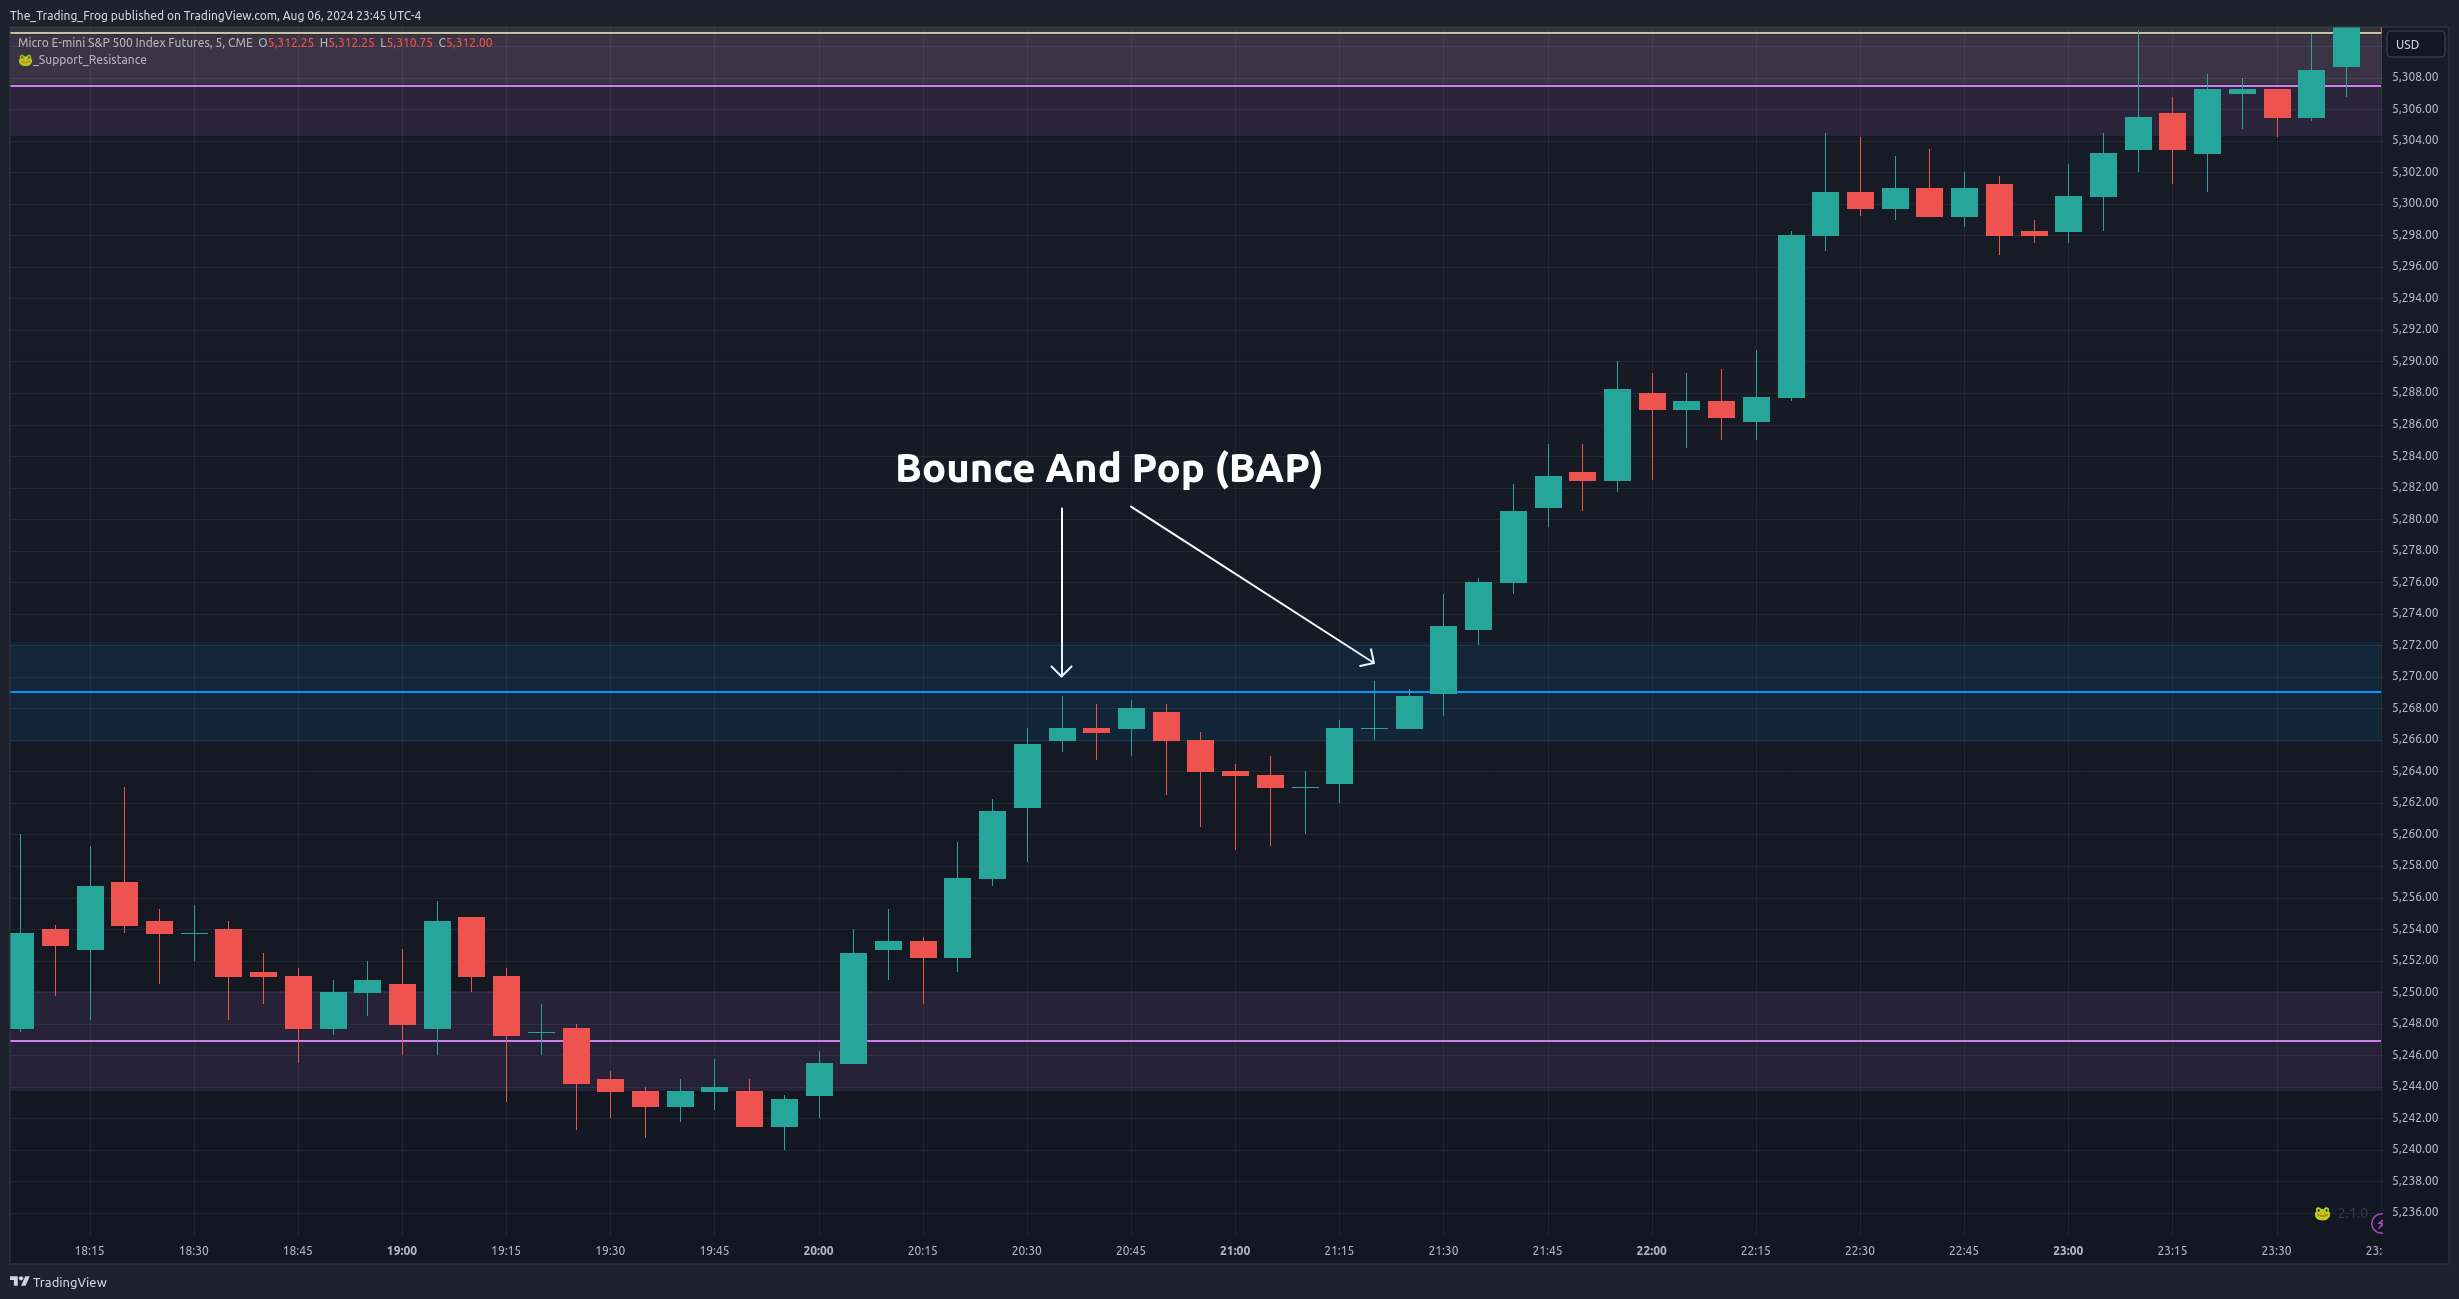
Look for a critical support or resistance level that has been tested multiple times. This level should have shown clear rejections in the past (price has bounced off it and reversed multiple times). Mark this level on your chart as a key area to watch.
-
Wait for a Rejection and Bounce
Wait for the price to approach this key level again. Look for a bounce or rejection off the level—this could be a candlestick pattern like a pin bar, hammer, or strong reversal candle. Confirm that the level still holds significance.
-
Monitor for a Break Through the Level
Keep an eye on price action as it moves back towards the key level. Look for a strong, decisive move breaking through the level. This could be a wide-range candlestick or an increase in volume that signals a potential “pop.” Avoid entering too early; let the price clearly break and confirm that the momentum is present.
-
Confirm the Break with Volume and Momentum
Check for higher volume on the break; increased volume indicates stronger conviction behind the move.
-
Enter the Trade
Enter a trade shortly after the breakout is confirmed. If you wait to long don't chase. Instead, wait for price to dip back to the level and treat it is a SBR trade instead. If it doesn't retrace, move on to the next setup.
-
Set Stop Loss
Place a stop loss just below (for a long trade) or above (for a short trade) the breakout level.
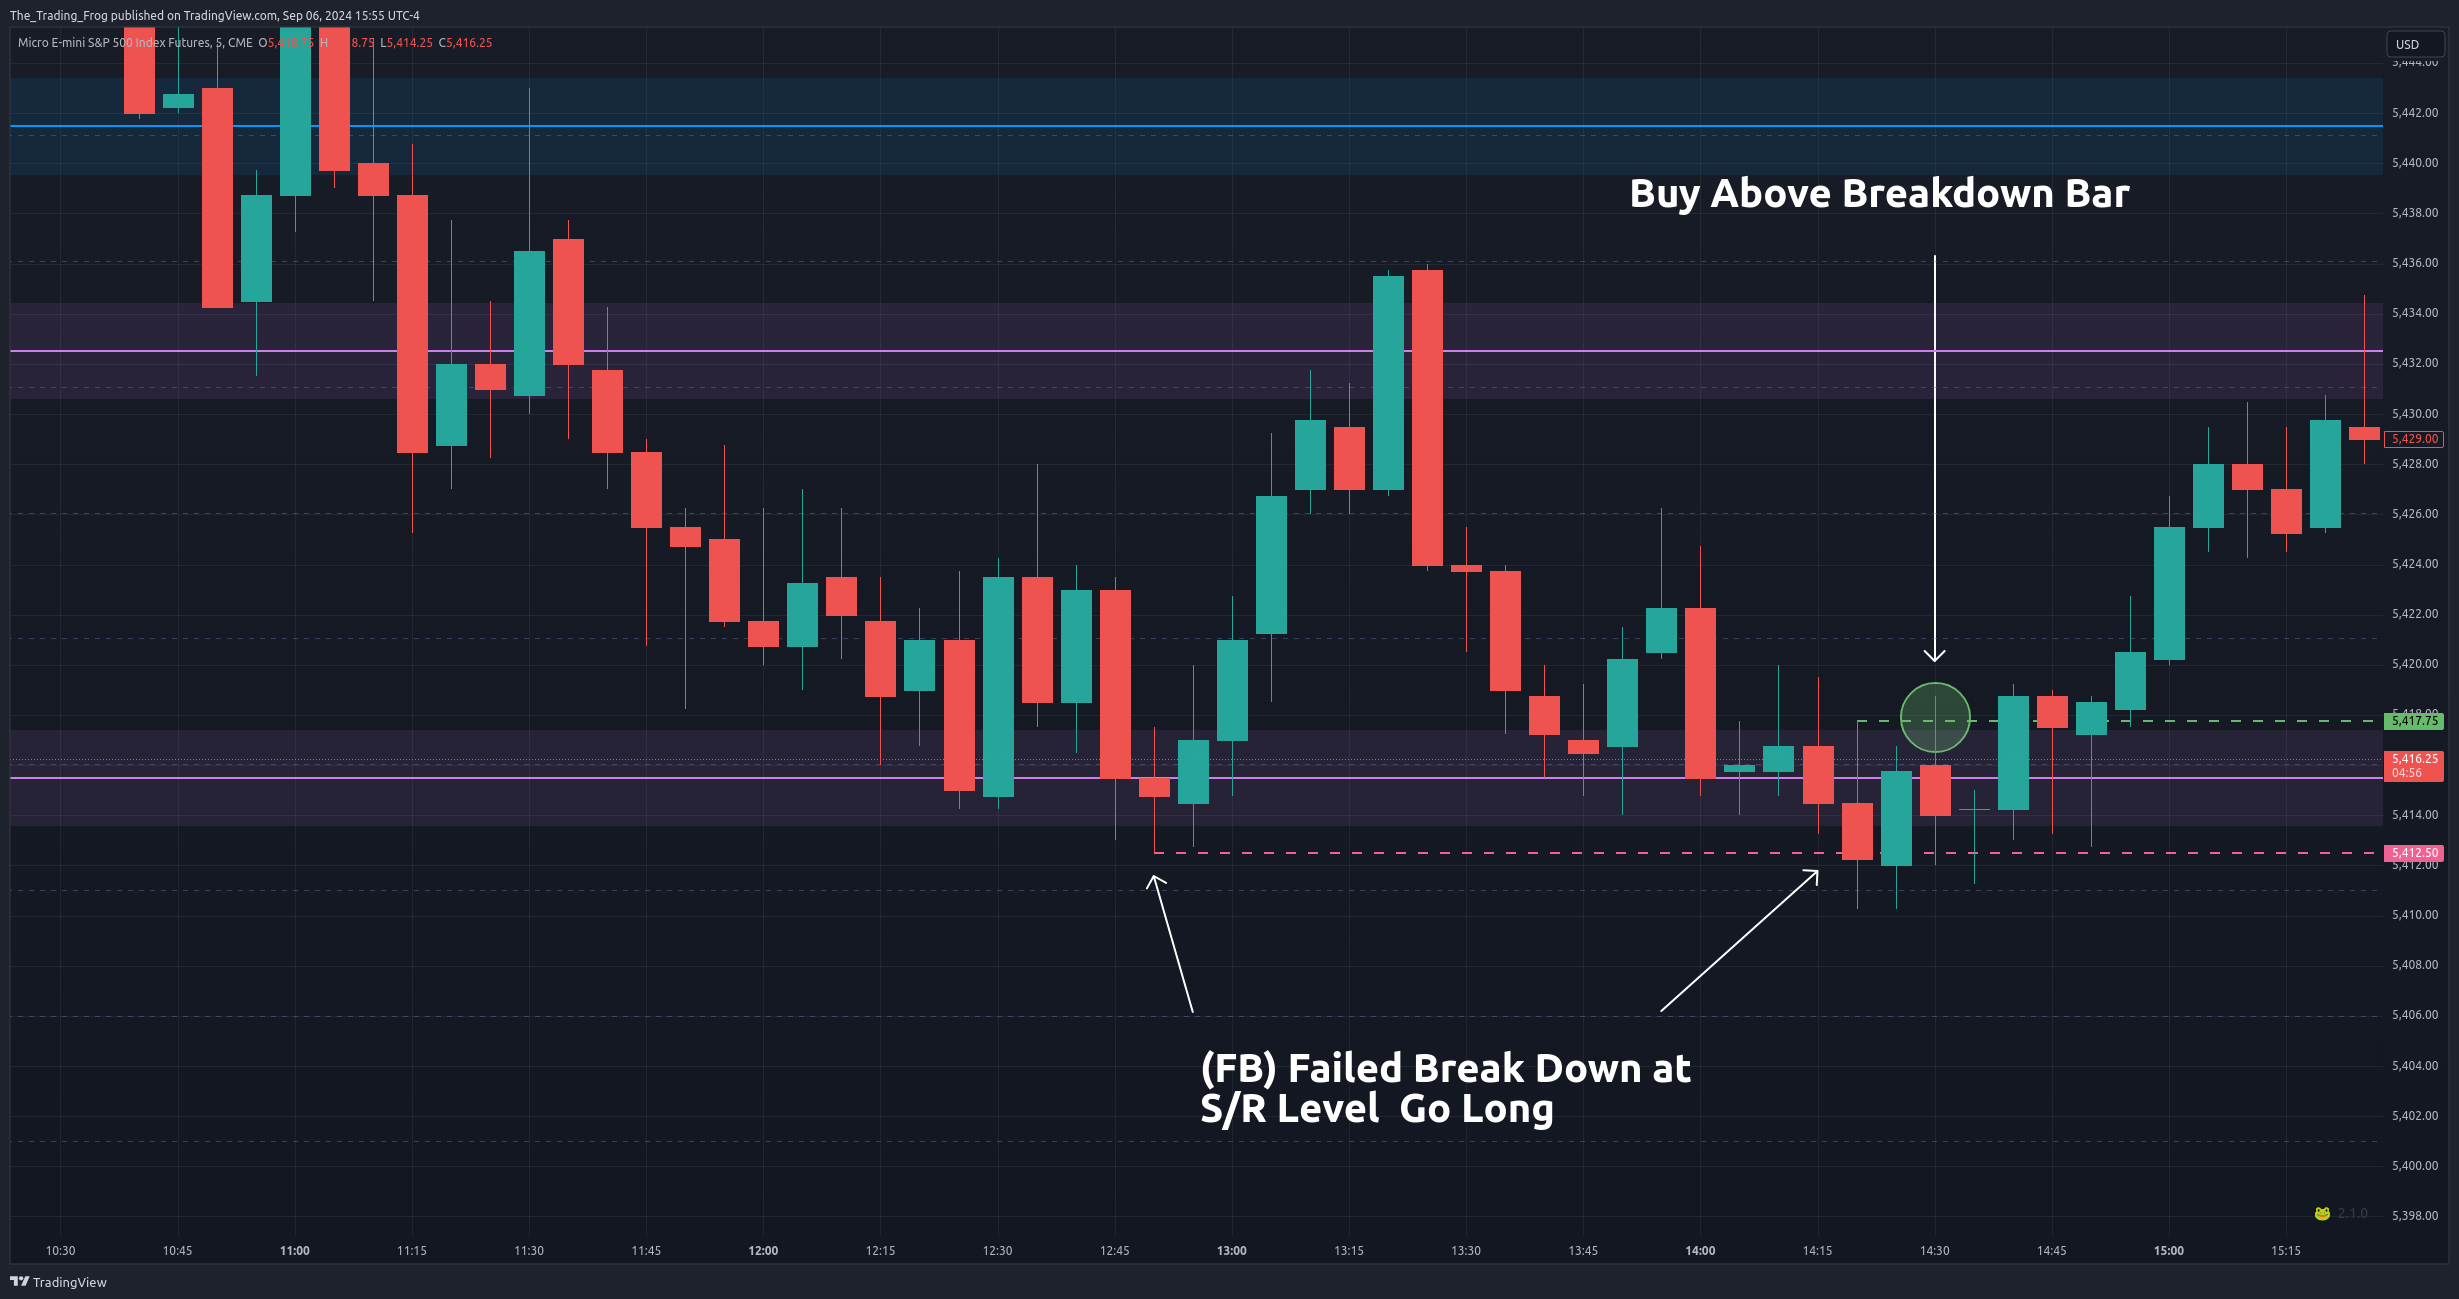
Failed Breakdown / Breakout (FB)
A false breakout or breakdown occurs when the price moves above a resistance level (breakout) or below a support level (breakdown) but quickly reverses direction. Traders are often caught off-guard as they expect the price to continue in the initial direction, only for it to turn back. False breakouts and breakdowns can trigger stop-loss orders and lead to quick reversals, trapping traders who acted prematurely.
The Setup
-
Identify a Key Level with Multiple Tests or Consolidation
Look for a clear support or resistance level that has been tested multiple times or where price has shown consolidation. The more times the level has been tested, the more significant it is, making a false breakout or breakdown at that level impactful.
-
Watch for a False Move to Trap Traders
Wait for a decisive push above resistance (for a breakout) or below support (for a breakdown). Observe if the move happens with low volume—this can be a signal that the breakout/breakdown may be false. A lack of volume suggests there is no strong support for the price move. If the breakout/breakdown is genuine, volume typically surges and you may want to avoid this setup.
-
Wait for Price to Reverse After the False Break
Be patient and watch for a quick reversal after the false move. This reversal usually catches traders who entered on the initial breakout/breakdown off-guard. A reversal candlestick pattern (e.g., an engulfing candle, pin bar, or hammer) can serve as a signal that the false move is complete. You are looking for price to break back into the previous trading range, indicating the breakout/breakdown was indeed false.
-
Enter the Trade Once the Reversal is Confirmed
For a Failed Breakdown (price initially moves below support but reverses upwards): Enter the trade when price crosses back above the high of the breakdown bar.
For a Failed Breakout (price initially moves above resistance but reverses downwards): Enter the trade when price crosses below the low of the breakout bar.
Entering at this confirmation point increases the probability of a successful reversal.
-
Place a Stop-Loss Near the Recent High/Low of the False Break
Place a tight stop-loss just beyond the recent high (in the case of a failed breakout) or low (in the case of a failed breakdown). This minimizes risk if the trade does not go as planned and the price resumes its initial breakout/breakdown direction. Using a tight stop also allows for a better risk-to-reward ratio.
Notes
Volume as a Key Indicator: Pay attention to volume during the breakout/breakdown and the reversal. Low volume during the false move followed by increased volume during the reversal can confirm the false breakout/breakdown.
Multiple Timeframes for Confirmation: Use higher timeframes to validate the pattern and get a clearer picture of the overall trend. This can help confirm whether the breakout/breakdown is truly false.
