Configuration
Adjusting the Range
Once the indicator is added to the chart you can adjust the time range to be analyzed by clicking anywhere on the indicator and then dragging the two circles that show up. See the video below for an example:
Adjusting the Appearance
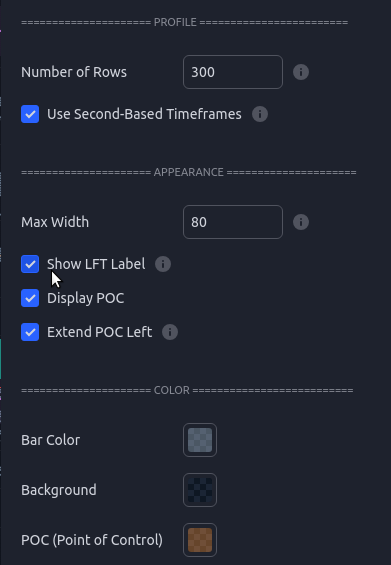
There are options to adjust the visual appearance of the indicator, including how wide it is allowed to be and whether or not to show the Point of Control.

The most commonly changed setting is the Max Width which can be used to scale the profile to ensure it fits on the chart and is large enough to show the details. See the video below for an example.